Level:
Correct: 0
Incorrect: 0
Marks: 0/0
Exam Practice
Course:
Topics:
Avg
score:
–
Topics
done:
0/31

The distance–time relationship

Practise 13 exam-style questions on The distance–time relationship for AQA GCSE Combined Science (Physics Paper 2). Write your answer as you would in the exam and get it marked in seconds against the mark scheme, point by point, with the Study Helper on hand if you get stuck.

  • 13 questions
  • 1–5 marks each
  • Instant marking
  • No sign-up needed
13 questions, marked as you go

Sample questions with model answers

Here are 4 of the questions in this topic, each with a model answer, an explanation of why it earns the marks and the mark scheme an examiner would use.

Question 1

2 marks

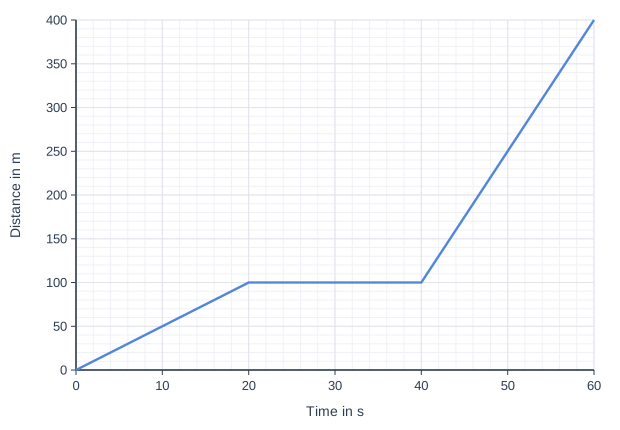
The graph shows the distance travelled by a car in town during 60 s.

Determine the speed of the car during the first 20 s.

Line graph of distance in m (y-axis, 0 to 400) against time in s (x-axis, 0 to 60). The line joins the points (0, 0), (20, 100), (40, 100), (60, 400).

Model answer

In the first 20 s the car travels 100 m.
speed = gradient = 100 ÷ 20 = 5 m/s

Explanation

The speed is the gradient of the distance–time graph. For a straight section, divide the distance travelled by the time taken.

Mark scheme
  1. 1 mark

    speed = 100 ÷ 20

    allow gradient = change in distance ÷ change in time; an answer of 5 m/s scores 2 marks

  2. 1 mark

    5 (m/s)

Question 2

2 marks

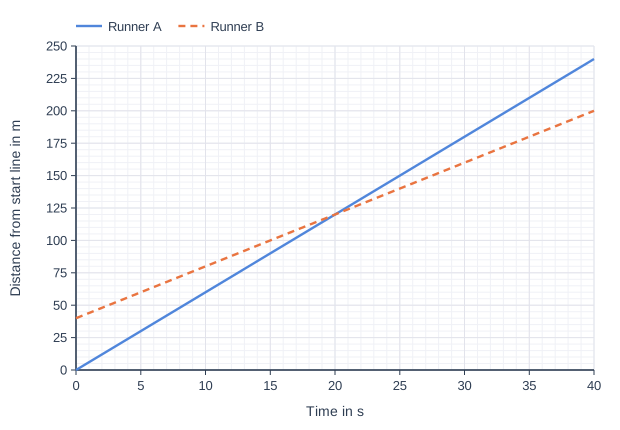
The graph shows the distance from the start line of two runners, A and B, during a race. Runner B was given a head start.

At what time does runner A overtake runner B? Explain how the graph shows this.

Line graph of distance from start line in m (y-axis, 0 to 250) against time in s (x-axis, 0 to 40). "Runner A" joins the points (0, 0), (40, 240). "Runner B" (dashed) joins the points (0, 40), (40, 200).

Model answer

Runner A overtakes runner B at 20 s. This is where the two lines cross: at that time both runners are 120 m from the start line, and after that A's line is above B's.

Explanation

Where two distance–time lines cross, the objects are at the same place at the same time. The steeper line belongs to the faster runner, so A catches up and then moves ahead.

Mark scheme
  1. 1 mark

    20 s

    allow 19-21 s; allow at 120 m from the start line

  2. 1 mark

    the lines cross / both runners are the same distance from the start line at that time

Question 3

3 marks

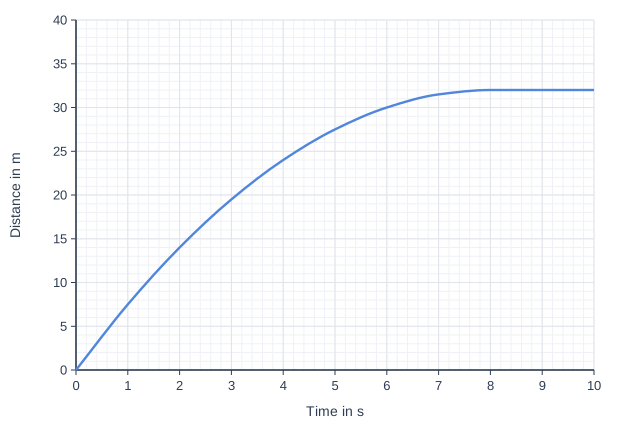
The graph shows the distance travelled by a cyclist during a 10 s period.

Describe the motion of the cyclist between 0 s and 10 s. Give reasons from the graph.

Line graph of distance in m (y-axis, 0 to 40) against time in s (x-axis, 0 to 10). The line is a smooth curve through (0, 0), (1, 7.5), (2, 14), (3, 19.5), (4, 24), (5, 27.5), (6, 30), (7, 31.5), (8, 32), (9, 32), (10, 32).

Model answer

From 0 to 8 s the gradient of the graph decreases, so the cyclist is slowing down (decelerating). From 8 s to 10 s the line is horizontal at 32 m, so the gradient is zero and the cyclist has stopped.

Explanation

The gradient of a distance–time graph is the speed. A curve that gets less steep shows a decreasing speed, and a horizontal line shows the object is stationary.

Mark scheme
  1. 1 mark

    the cyclist slows down / decelerates (from 0 to 8 s)

  2. 1 mark

    because the gradient (of the curve) decreases

    allow the line gets less steep

  3. 1 mark

    the cyclist is stationary from 8 s to 10 s because the line is horizontal

    allow stops after about 8 s

Question 4

4 marks

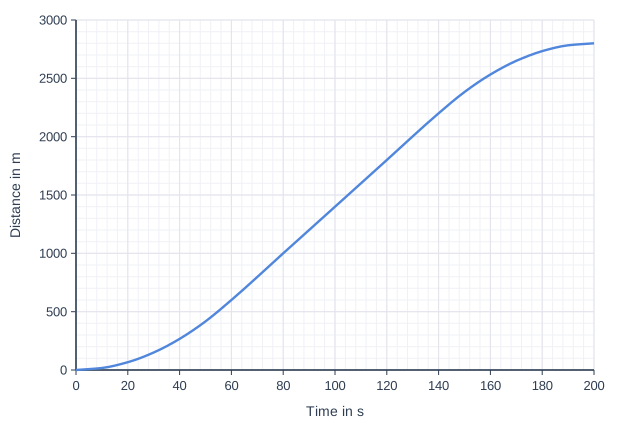
The graph shows the distance travelled by a train between leaving one station and stopping at the next.

Describe the motion of the train. Refer to the gradient of the graph in your answer.

Line graph of distance in m (y-axis, 0 to 3000) against time in s (x-axis, 0 to 200). The line is a smooth curve through (0, 0), (10, 17), (20, 67), (30, 150), (40, 267), (50, 417), (60, 600), (80, 1000), (100, 1400), (120, 1800), (140, 2200), (150, 2383), (160, 2533), (170, 2650), (180, 2733), (190, 2783), (200, 2800).

Model answer

From 0 to 60 s the gradient increases, so the train is speeding up. From 60 s to 140 s the graph is a straight line, so the train travels at a constant speed; the gradient is (2200 − 600) ÷ 80 = 20 m/s. From 140 s to 200 s the gradient decreases, so the train is slowing down, and at 200 s the gradient is zero, so the train has stopped, 2800 m from the first station.

Explanation

On a distance–time graph the gradient is the speed: an increasing gradient means speeding up, a constant gradient means constant speed and a decreasing gradient means slowing down.

Mark scheme
  1. 1 mark

    0-60 s: the gradient increases so the train is speeding up / accelerating

    max 4

  2. 1 mark

    60-140 s: the graph is a straight line (constant gradient) so the train moves at a constant speed

  3. 1 mark

    the constant speed is 20 m/s

    allow (2200 − 600) ÷ 80 = 20 m/s

  4. 1 mark

    140-200 s: the gradient decreases so the train is slowing down / decelerating

  5. 1 mark

    at 200 s the gradient is zero so the train has stopped (after 2800 m)

Ready to try the rest? Every answer you write is marked against the mark scheme, so you can see exactly where the marks are.

Revision notes

The distance–time relationship

The big idea

A distance–time graph shows how far an object moving along a straight line has travelled at each moment. Its shape tells you at a glance whether the object is stopped, moving steadily, speeding up or slowing down, and its gradient (steepness) gives the speed. Exam questions ask you to read these graphs, calculate speeds from them and draw them from data.

Reading the shape

The gradient of a distance–time graph is the speed, because

\[\text{gradient} = \dfrac{\text{change in distance}}{\text{change in time}} = \text{speed}\]
Shape of the lineWhat the object is doing
Horizontal lineStationary (speed is zero)
Straight line sloping upMoving at a constant speed
Steeper straight lineMoving at a greater constant speed
Curve getting steeperSpeeding up (accelerating)
Curve getting less steepSlowing down (decelerating)
Line graph of distance in m (y-axis, 0 to 100) against time in s (x-axis, 0 to 10). "A: 10 m/s" joins the points (0, 0), (10, 100). "B: 3 m/s" (dashed) joins the points (0, 0), (10, 30). "C: stationary" joins the points (0, 50), (10, 50).
Object A has the steepest line, so it is fastest. Object C stays 50 m from the starting point, so it is not moving.

Calculating speed from the gradient

For a straight section of the graph:

  1. Pick two points on the line that are far apart (a large triangle reduces reading errors).
  2. Read the change in distance and the change in time between them.
  3. Divide: speed = change in distance ÷ change in time.

This is the speed equation, \(\text{distance travelled} = \text{speed} \times \text{time}\) (\(s = vt\)), which you must recall. Check the axis units first: if the graph uses km and minutes, convert to m and s to get a speed in m/s. If the line does not start at the origin, the object was already some distance from the reference point when timing began; the speed still comes from the gradient, not from one reading divided by its time.

Predicting where a runner will be

On a runner's distance–time graph, a straight section runs from (20 s, 80 m) to (50 s, 230 m). Calculate her speed, and predict how far she will have run at 70 s if she keeps this speed.

\(\text{speed} = \dfrac{230 - 80}{50 - 20} = \dfrac{150}{30} = 5.0\) m/s

In the next 20 s she runs \(s = vt = 5.0 \times 20 = 100\) m, so at 70 s she has run \(230 + 100 = 330\) m.

Drawing a distance–time graph

  • Put time on the x-axis (the independent variable) and distance on the y-axis.
  • Choose scales that use at least half of the grid, and label each axis with its unit.
  • Plot each pair of values with a neat cross, then draw a straight line or a smooth curve of best fit.
  • From speeds and times, work out each section's distance with \(s = vt\) and add it to the total so far; a stop is a horizontal line.

You can also translate the other way: equal distances in equal times mean a constant speed and a straight line; distances that grow each interval mean speeding up and a curve.

Higher tier only

Speed at one instant. When an object is accelerating, its distance–time graph is a curve and the speed keeps changing. To find the speed at a particular time, draw a tangent to the curve at that time (a straight line that just touches the curve there) and measure the gradient of the tangent.

Line graph of distance in m (y-axis, 0 to 40) against time in s (x-axis, 0 to 14). "Cyclist" is a smooth curve through (0, 0), (1, 5.75), (2, 11), (3, 15.75), (4, 20), (5, 23.75), (6, 27), (7, 29.75), (8, 32), (9, 33.75), (10, 35), (11, 35.75), (12, 36), (14, 36). "Tangent at 4 s" (dashed) joins the points (0, 4), (8, 36).
A cyclist brakes gently to a stop: the curve gets less steep. The dashed tangent touches the curve at 4 s.

Worked example: the tangent passes through (0 s, 4 m) and (8 s, 36 m), so the speed at 4 s is \(\dfrac{36 - 4}{8 - 0} = 4.0\) m/s. Later the curve is flatter, so she is slower; from 12 s it is horizontal, because she has stopped.

Common mistakes

  • Reading a horizontal line as "constant speed". On a distance–time graph it means stationary.
  • Finding the speed of one section by dividing the final distance by the final time. Use the changes across that section.
  • Forgetting to convert km and minutes before giving a speed in m/s.
  • Mixing up graph types: the gradient of a distance–time graph is the speed, but the gradient of a velocity–time graph is the acceleration. Check the y-axis label first.

Exam tip

In "describe the motion" questions, take the graph section by section, name the shape, say what it means and quote a speed for each straight part. Marks are often given for using values from the graph, not just for words such as "faster".

Study Helper Hints first, answers after you try

Stuck on this one? Ask for a hint and I’ll point you in the right direction, without giving the answer away. Once you’ve checked your answer, I’ll show you how the marks are awarded.