The big idea
Your reaction time is the time between noticing something (a stimulus) and responding to it. For a driver, it is the time between seeing a hazard and pressing the brake, and the car keeps moving at full speed throughout it. A longer reaction time means a longer thinking distance, and so a longer stopping distance.
Typical values and what affects them
Reaction times vary from person to person. Typical values range from 0.2 s to 0.9 s. A simple test where you are concentrating and waiting for a signal gives values near 0.2 s; a driver reacting to an unexpected hazard is usually slower.
A driver's reaction time can be increased by:
- tiredness;
- alcohol;
- drugs, including some medicines;
- distractions, such as using a phone, adjusting a sat nav or talking to passengers. These delay the driver noticing the hazard in the first place.
Measuring reaction time: the ruler drop
- The catcher rests their forearm on the edge of a table, with thumb and finger held open on either side of a metre rule, not touching it.
- A partner holds the rule vertically, with the zero mark level with the top of the catcher's thumb.
- The partner drops the rule without warning, after a random wait, so the catcher cannot anticipate it.
- The catcher catches it as quickly as possible. Read the distance fallen at the top of the thumb.
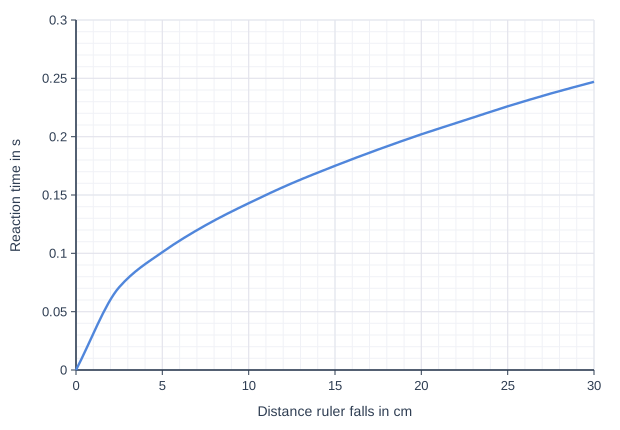
- Convert the distance into a time using a conversion table or graph. The rule speeds up as it falls, so the distance is not directly proportional to the time; a longer drop still means a longer reaction time.
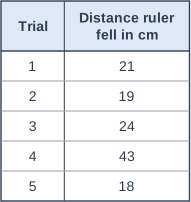
- Repeat about ten times, leave out anomalous results and calculate a mean. Keep the same hand, the same rule and the same person dropping it.
Typical results are about 0.15-0.25 s. A hand-held stopwatch is no use here: the timer's own reaction time is as big as the time being measured. A computer test (press a key when the screen changes colour) times electronically and needs no conversion, but it is still a simple, expected response.
Effect on thinking distance
\[\text{thinking distance} = \text{speed} \times \text{reaction time}\]
This is the recalled equation \(s = vt\). At a constant speed, doubling the reaction time doubles the thinking distance. Reaction time does not change the braking distance, which depends on the speed, the road and the vehicle.
The extra distance caused by a slow reaction grows with speed: an extra 0.3 s adds 3 m at 10 m/s but 9 m at 30 m/s.
How fast before it matters?
A driver's reaction time is 0.6 s when concentrating, but 0.8 s while chatting to a passenger. At what speed does chatting add 5 m to her thinking distance?
Extra reaction time: \(0.8 - 0.6 = 0.2\) s
Extra thinking distance = speed × extra time, so \(5 = v \times 0.2\)
\(v = \dfrac{5}{0.2} = 25\) m/s (about 56 mph)
Interpreting and evaluating data
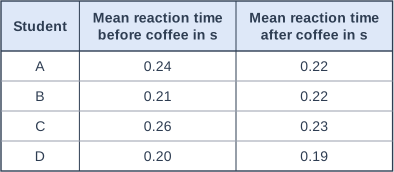
When you compare reaction times, for example before and after a distraction:
- compare the means, and use the size of the difference, not just "it went up";
- look at the spread (range) of the results: if the ranges overlap a lot, a small difference is weak evidence;
- check the sample size (a few students may not be representative) and whether other variables were controlled;
- link any change in reaction time to the thinking distance at a stated speed.
Common mistakes
- Saying tiredness, alcohol or a phone increases the braking distance. They increase the reaction time, so the thinking distance.
- Warning the catcher before dropping the ruler, which makes the reaction time too short.
- Assuming that twice the drop distance means twice the reaction time. Use the conversion table or graph.
- Including an anomalous result in the mean.
Exam tip
For "evaluate" questions on reaction-time data, give a point for the claim using numbers, a point against (spread, sample size or control variables), and a conclusion. Answers that only list advantages or only disadvantages are capped.