Level:
Correct: 0
Incorrect: 0
Marks: 0/0
Exam Practice
Course:
Topics:
Avg
score:
–
Topics
done:
0/31

Factors affecting braking distance 1

Practise 14 exam-style questions on Factors affecting braking distance 1 for AQA GCSE Combined Science (Physics Paper 2). Write your answer as you would in the exam and get it marked in seconds against the mark scheme, point by point, with the Study Helper on hand if you get stuck.

  • 14 questions
  • 1–6 marks each
  • Instant marking
  • No sign-up needed
14 questions, marked as you go

Sample questions with model answers

Here are 4 of the questions in this topic, each with a model answer, an explanation of why it earns the marks and the mark scheme an examiner would use.

Question 1

2 marks

Give two factors relating to the condition of a car that can increase its braking distance.

Model answer

Worn brakes. Worn tyres with very little tread.

Explanation

Worn brakes produce a smaller friction force, and worn tyres grip the road less, so the braking force and the deceleration are smaller and the car travels further before it stops. Road and weather conditions also affect braking distance, but they are not part of the condition of the car.

Mark scheme
  1. 1 mark

    worn brakes / brakes in poor condition

    allow worn brake pads or brake discs; allow faulty brakes

  2. 1 mark

    worn tyres / tyres with too little tread

    allow bald tyres; allow tyres that are under-inflated or incorrectly inflated; do not accept road or weather conditions, speed or driver factors such as tiredness

Question 2

2 marks

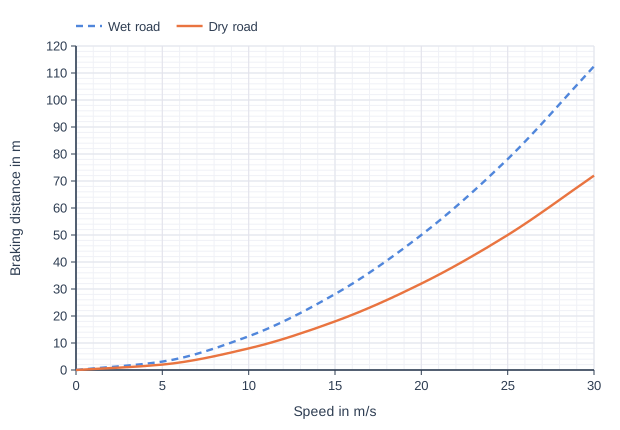
The graph shows how the braking distance of a car depends on its speed on a dry road and on a wet road.

Determine how much further the car travels while braking on the wet road than on the dry road when its speed is 20 m/s.

Line graph of braking distance in m (y-axis, 0 to 120) against speed in m/s (x-axis, 0 to 30). "Wet road" (dashed) is a smooth curve through (0, 0), (5, 3.125), (10, 12.5), (15, 28.125), (20, 50), (25, 78.125), (30, 112.5). "Dry road" is a smooth curve through (0, 0), (5, 2), (10, 8), (15, 18), (20, 32), (25, 50), (30, 72).

Model answer

At 20 m/s: wet road braking distance = 50 m, dry road braking distance = 32 m
Difference = 50 − 32 = 18 m

Explanation

Read both curves at the same speed, then subtract. The wet road gives a longer braking distance at every speed because water reduces the friction between the tyres and the road, so the deceleration is smaller.

Mark scheme
  1. 1 mark

    dry road braking distance = 32 m and wet road braking distance = 50 m

    allow 31-33 m and 49-51 m; an answer of 18 m scores 2 marks

  2. 1 mark

    18 (m)

    allow 16-20 (m); allow ecf from incorrect readings

Question 3

3 marks

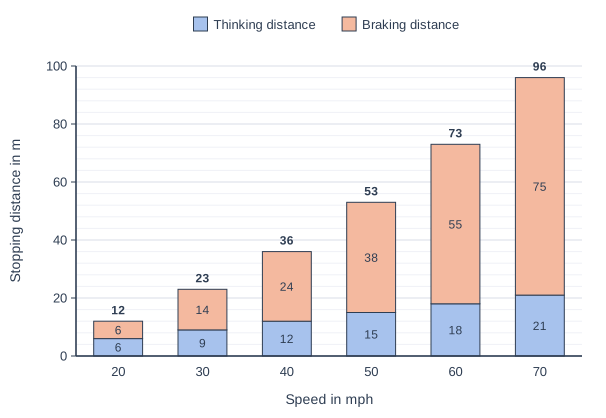
The chart shows typical stopping distances for a car on a dry road at different speeds.

Compare how the thinking distance and the braking distance change as the speed increases.
Use data from the chart in your answer.

Stacked bar chart with 6 vertical bars. The value axis (y-axis) is "Stopping distance in m", from 0 to 100 marked every 20; the bars are labelled along the x-axis, "Speed in mph", from left to right. Each bar is split into 2 parts, shown in the key: Thinking distance (bottom, blue) and Braking distance (top, orange). Values: 20 mph: thinking distance 6 m, braking distance 6 m, total 12 m; 30 mph: thinking distance 9 m, braking distance 14 m, total 23 m; 40 mph: thinking distance 12 m, braking distance 24 m, total 36 m; 50 mph: thinking distance 15 m, braking distance 38 m, total 53 m; 60 mph: thinking distance 18 m, braking distance 55 m, total 73 m; 70 mph: thinking distance 21 m, braking distance 75 m, total 96 m. The value of each part is printed on it. Each bar's total is printed above it.

Model answer

Both distances increase as the speed increases. Thinking distance is directly proportional to speed: it doubles from 6 m at 20 mph to 12 m at 40 mph. Braking distance increases much faster: it goes from 6 m at 20 mph to 24 m at 40 mph, four times as far. At 20 mph the two distances are equal, but at 70 mph the braking distance (75 m) is more than three times the thinking distance (21 m).

Explanation

During the thinking time the car moves at constant speed, so thinking distance = speed × reaction time and is proportional to speed. During braking the car must lose its kinetic energy, which depends on speed squared, so doubling the speed makes the braking distance about four times longer.

Mark scheme
  1. 1 mark

    thinking distance is directly proportional to speed / doubles when the speed doubles, e.g. 6 m at 20 mph and 12 m at 40 mph

    allow increases by 3 m for every 10 mph

  2. 1 mark

    braking distance increases faster than the speed / is not proportional to speed, e.g. 6 m at 20 mph but 24 m at 40 mph (four times as far)

    allow any correct data showing braking distance more than doubles when speed doubles, e.g. 14 m at 30 mph and 55 m at 60 mph

  3. 1 mark

    at higher speeds the braking distance becomes a much bigger part of the stopping distance, e.g. equal at 20 mph (6 m each) but at 70 mph braking distance 75 m and thinking distance 21 m

    data quoted must be correct; full marks need at least one correct use of data

Question 4

4 marks

Drivers are advised to leave a much larger gap between their car and the vehicle in front when the road is icy.

Explain why.

Model answer

Ice reduces the friction between the tyres and the road. This means only a small braking force can be applied before the tyres skid, so the deceleration of the car is much smaller. The car therefore travels a much greater distance while braking, so the stopping distance is longer. A larger gap gives the driver enough distance to stop without crashing into the vehicle in front.

Explanation

On ice the braking distance can be up to ten times longer than on a dry road. The thinking distance does not change, but the much longer braking distance means the usual gap is not enough to stop safely in an emergency.

Mark scheme
  1. 1 mark

    ice reduces the friction (grip) between the tyres and the road

  2. 1 mark

    so the maximum braking force is smaller / the tyres skid more easily when the brakes are applied

    allow the driver may lose control

  3. 1 mark

    so the deceleration is smaller

  4. 1 mark

    so the braking distance (and stopping distance) is greater and a larger gap is needed to stop without hitting the vehicle in front

    do not accept the thinking distance increases

Ready to try the rest? Every answer you write is marked against the mark scheme, so you can see exactly where the marks are.

Revision notes

Factors affecting braking distance 1

The big idea

The braking distance is how far a vehicle travels after the brakes are applied. It is longer on wet or icy roads and when the brakes or tyres are in poor condition. Knowing why lets you explain safety advice, and estimate how far a vehicle needs to stop in an emergency at different speeds.

Road and weather conditions

Adverse road conditions include wet and icy roads (snow, oil, wet leaves and loose gravel have a similar effect). They all work the same way:

  1. There is less friction (grip) between the tyres and the road.
  2. So the maximum braking force that can act before the wheels lock and skid is smaller.
  3. So the deceleration is smaller and the vehicle travels further before it stops.

As a rough guide, the braking distance on a wet road can be about twice the dry value, and on ice it can be up to ten times as long. Braking very hard on ice makes the wheels lock: the car skids, cannot be steered, and takes even longer to stop.

These conditions do not change the thinking distance: during the driver's reaction time the brakes are not yet working, so the grip of the tyres does not matter.

Condition of the vehicle

For braking distance, poor condition of the vehicle means the brakes or the tyres.

ProblemEffectWhy
Worn brakesLonger braking distanceLess friction between the brake pads and discs, so a smaller braking force and a smaller deceleration
Worn tyres (shallow tread)Longer braking distance, especially when wetThe tread channels water away; without it a layer of water stays between the tyre and the road, so there is less grip

A heavily loaded vehicle also takes further to stop, because the same braking force gives a larger mass a smaller deceleration.

Implications for safety

  • Drive more slowly in wet or icy weather: a lower speed shortens both the thinking and the braking distance.
  • Leave a bigger gap behind the vehicle in front, at least as long as your stopping distance.
  • On ice, brake gently and early to avoid skidding.
  • Check tyre tread and brakes regularly and replace them before they are badly worn.
  • Councils spread salt and grit: salt melts ice and grit roughens the surface, so the friction is greater.

Estimating emergency stopping distances

To estimate how the distance needed to stop varies over a range of typical speeds, use a typical reaction time (~ 0.7 s) and a typical deceleration: ~ 7 m/s² on a dry road, about half that on a wet road, and as little as ~ 1 m/s² on ice.

  • Thinking distance = speed × reaction time (\(s = vt\), recalled).
  • Braking distance from \(v^2 - u^2 = 2as\) (given on the equation sheet). With final velocity \(v = 0\), the size of the braking distance is \(s = \dfrac{u^2}{2a}\), using the size of the deceleration for a.

Dry and wet roads at 40 mph and 70 mph

Estimate the stopping distances of a car at 18 m/s (40 mph) and 31 m/s (70 mph), on a dry road (deceleration ~ 7 m/s²) and a wet road (~ 3.5 m/s²). Reaction time ~ 0.7 s.

At 18 m/s: thinking distance \(= 18 \times 0.7 \approx 13\) m. Braking: dry \(\dfrac{18^2}{2 \times 7} \approx 23\) m; wet \(\dfrac{18^2}{2 \times 3.5} \approx 46\) m. Stopping distance: dry ~ 36 m, wet ~ 59 m.

At 31 m/s: thinking distance \(= 31 \times 0.7 \approx 22\) m. Braking: dry \(\dfrac{31^2}{2 \times 7} \approx 69\) m; wet \(\dfrac{31^2}{2 \times 3.5} \approx 137\) m. Stopping distance: dry ~ 91 m, wet ~ 159 m.

The wet road adds about 23 m at 40 mph but about 70 m at 70 mph.

Stacked bar chart with 4 vertical bars. The value axis (y-axis) is "Stopping distance in m", from 0 to 180 marked every 20; the bars are labelled along the x-axis, "Speed and road", from left to right. Each bar is split into 2 parts, shown in the key: Thinking distance (bottom, blue) and Braking distance (top, orange). Values: 40 mph dry: thinking distance 13 m, braking distance 23 m, total 36 m; 40 mph wet: thinking distance 13 m, braking distance 46 m, total 59 m; 70 mph dry: thinking distance 22 m, braking distance 69 m, total 91 m; 70 mph wet: thinking distance 22 m, braking distance 137 m, total 159 m. The value of each part is printed on it. Each bar's total is printed above it.
The estimates from the worked example: the wet road changes only the braking distance.

Common mistakes

  • Saying that wet roads, ice or worn tyres increase the thinking distance. They affect only the braking distance.
  • Saying "the road is slippery" without the physics: say there is less friction between the tyres and the road, so the deceleration is smaller.
  • Multiplying the whole stopping distance by ten for ice. Only the braking distance changes.
  • Naming fog as a road condition that increases braking distance. Fog reduces visibility; it is wet or icy surfaces that reduce grip.

Exam tip

For "explain" questions about a factor, write the full chain: less friction → smaller braking force → smaller deceleration → longer braking distance. For "implications for safety", add a sensible action, such as slowing down or leaving a bigger gap.

Study Helper Hints first, answers after you try

Stuck on this one? Ask for a hint and I’ll point you in the right direction, without giving the answer away. Once you’ve checked your answer, I’ll show you how the marks are awarded.