Level:
Correct: 0
Incorrect: 0
Marks: 0/0
Exam Practice
Course:
Topics:
OCR GCSE Chemistry (Paper 4) Smart practice A mixed round aimed at your weak spots
Unit 4
Predicting and identifying reactions and products
Unit 5
Monitoring and controlling chemical reactions
Unit 6
Global challenges
Unit 7
Practical skills
Avg
score:
–
Topics
done:
0/37

Life-cycle assessments

Practise 15 exam-style questions on Life-cycle assessments for OCR GCSE Chemistry (Paper 4). Write your answer as you would in the exam and get it marked in seconds against the mark scheme, point by point, with the Study Helper on hand if you get stuck.

  • 15 questions
  • 1–6 marks each
  • Instant marking
  • No sign-up needed
15 questions, marked as you go

Sample questions with model answers

Here are 4 of the questions in this topic, each with a model answer, an explanation of why it earns the marks and the mark scheme an examiner would use.

Question 1

1 mark

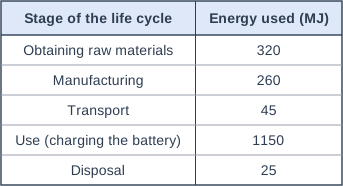
The table shows estimates from a life-cycle assessment of a cordless vacuum cleaner that is used for 6 years.

What percentage of the total energy is used in the use stage?

Choose your answer.

  • A 14%
  • B 18%
  • C 36%
  • D 64%
Table with columns "Stage of the life cycle", "Energy used (MJ)". Stage of the life cycle: Obtaining raw materials; Energy used (MJ): 320 | Stage of the life cycle: Manufacturing; Energy used (MJ): 260 | Stage of the life cycle: Transport; Energy used (MJ): 45 | Stage of the life cycle: Use (charging the battery); Energy used (MJ): 1150 | Stage of the life cycle: Disposal; Energy used (MJ): 25.

Model answer

D

Total energy = 320 + 260 + 45 + 1150 + 25 = 1800 MJ
Percentage in the use stage = 1150 ÷ 1800 × 100 = 63.9% (about 64%)

Explanation

Add the energy for every stage to find the total, then divide the value for the use stage by the total and multiply by 100. For an appliance that uses electricity, the use stage is often the largest part of its LCA. A common error is to divide by the wrong stage or to give the percentage for all the other stages.

Mark scheme
  1. 1 mark

    D / 64%

    The only correct answer is D: the total energy is 320 + 260 + 45 + 1150 + 25 = 1800 MJ, and 1150 ÷ 1800 × 100 = 63.9%, which is about 64%. A is not correct because 14% is the manufacturing stage (260 ÷ 1800); B is not correct because 18% is the raw materials stage (320 ÷ 1800); C is not correct because 36% is the percentage for all the other stages together (100 − 64). ALLOW the letter or the option. If more than one option is given, do not award the mark.
Question 2

2 marks

A company makes garden chairs from new poly(propene). The chemicals used to make this polymer are obtained from crude oil.

Describe two environmental impacts that the company should include in the stage of its life-cycle assessment for obtaining and processing the raw materials.

Model answer

1. Crude oil is a finite resource, and making the poly(propene) uses some of it up.
2. Large amounts of energy are used to separate the crude oil, crack the fractions and make the polymer. This energy usually comes from burning fossil fuels, which releases carbon dioxide, a greenhouse gas.

Explanation

The first stage of an LCA includes the resources used and the environmental impacts of getting the raw materials and turning them into a material, here from crude oil to poly(propene). Good answers name a specific impact, such as using up a finite resource, oil spills or carbon dioxide from burning fuels, rather than just 'pollution'.

Mark scheme
  1. 1 mark

    crude oil is a finite / non-renewable resource, which is used up

    1 mark for each impact, max 2. IGNORE 'pollution' unless it is described (for example oil spills or carbon dioxide).

  2. 1 mark

    drilling for and transporting crude oil can damage habitats / cause oil spills that pollute the sea or land

    ALLOW land is used for oil wells or refineries.

  3. 1 mark

    energy is used in separating the crude oil (fractional distillation), cracking and making the polymer, usually from burning fossil fuels, which releases carbon dioxide (adding to climate change)

    ALLOW burning fuels releases carbon dioxide / greenhouse gases. ALLOW large amounts of energy are used.

  4. 1 mark

    another described impact of extracting or refining the crude oil, for example sulfur dioxide or other waste gases released by the refinery (causing acid rain), or toxic waste

    ALLOW other valid described impacts of obtaining or processing the raw materials.

Question 3

3 marks

A company sells toothbrushes with bamboo handles. Its advert says:

'Our bamboo toothbrush has no impact on the environment, because bamboo is a renewable resource.'

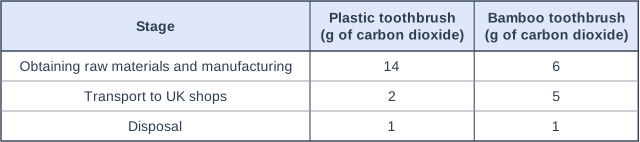
The table shows the company's estimates of the carbon dioxide released for each toothbrush. The bristles of both toothbrushes are made of nylon, a polymer made from crude oil.

Evaluate the company's claim. Use data from the table.

Table with columns "Stage", "Plastic toothbrush (g of carbon dioxide)", "Bamboo toothbrush (g of carbon dioxide)". Stage: Obtaining raw materials and manufacturing; Plastic toothbrush (g of carbon dioxide): 14; Bamboo toothbrush (g of carbon dioxide): 6 | Stage: Transport to UK shops; Plastic toothbrush (g of carbon dioxide): 2; Bamboo toothbrush (g of carbon dioxide): 5 | Stage: Disposal; Plastic toothbrush (g of carbon dioxide): 1; Bamboo toothbrush (g of carbon dioxide): 1.

Model answer

The claim is partly supported, because the bamboo toothbrush releases less carbon dioxide in total than the plastic toothbrush: 12 g compared with 17 g. Most of the saving is in obtaining the raw materials and manufacturing (6 g compared with 14 g).

However, the claim that it has no impact is wrong. It still releases 12 g of carbon dioxide over its life, and its transport stage releases more than the plastic toothbrush (5 g compared with 2 g). Also, its bristles are nylon made from crude oil, which is a finite resource, so not all of the toothbrush is renewable.

Explanation

Use the data to test each part of the claim: find the totals (17 g and 12 g) and compare the stages. A renewable material can reduce the impact of the raw materials stage, but every product uses energy and resources to make, transport and dispose of it, so no product has 'no impact'. Weak answers simply agree or disagree without using numbers from the table.

Mark scheme
  1. 1 mark

    (for the claim) the bamboo toothbrush releases less carbon dioxide in total than the plastic toothbrush (12 g compared with 17 g)

    Max 2 if no data from the table are used. Max 3. ALLOW a correct comparison of the raw materials and manufacturing stage (6 g compared with 14 g).

  2. 1 mark

    (against the claim) its impact is not zero: it still releases carbon dioxide (12 g) at every stage of its life

    ALLOW it still uses energy / resources to make, transport and dispose of it.

  3. 1 mark

    (against the claim) its transport stage releases more carbon dioxide than for the plastic toothbrush (5 g compared with 2 g), for example because it is carried further

    ALLOW the bamboo toothbrush releases more than twice as much carbon dioxide in transport.

  4. 1 mark

    (against the claim) the bristles are made from crude oil, which is a finite / non-renewable resource, so not all of the toothbrush is renewable

    ALLOW the nylon bristles do not biodegrade.

Question 4

4 marks

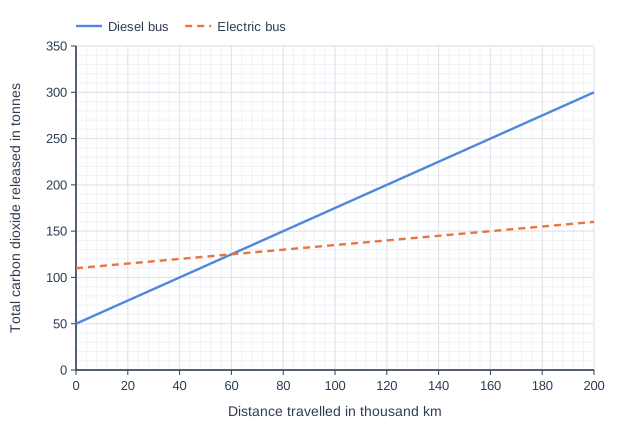
A transport company is choosing between a diesel bus and an electric bus. The graph shows a scientist's estimates of the total mass of carbon dioxide released by each bus, including the carbon dioxide released in making it, against the distance the bus has travelled.

Use the graph to find the distance after which the total mass of carbon dioxide released is the same for both buses.

Explain what the intercept on the y-axis and the gradient of each line show, and use them to compare the two buses.

Line graph of total carbon dioxide released in tonnes (y-axis, 0 to 350) against distance travelled in thousand km (x-axis, 0 to 200). "Diesel bus" joins the points (0, 50), (200, 300). "Electric bus" (dashed) joins the points (0, 110), (200, 160).

Model answer

The lines cross at 60 000 km, so the totals are equal after the buses have travelled 60 000 km.

The y-intercept is the carbon dioxide released in making each bus, before it has travelled any distance. Making the electric bus releases more (110 t compared with 50 t), for example because of its large battery.

The gradient is the carbon dioxide released for each km travelled. The diesel bus's line is much steeper: (300 − 50) ÷ 200 = 1.25 t for each 1000 km, compared with (160 − 110) ÷ 200 = 0.25 t for each 1000 km for the electric bus, because the diesel bus burns fuel in its engine, while the electric bus's carbon dioxide comes only from generating its electricity.

So the electric bus starts with a bigger total, but after 60 000 km it has released less carbon dioxide, and by 200 000 km it has released 160 t compared with 300 t for the diesel bus.

Explanation

Each line has the form y = mx + c: the intercept c is the fixed carbon dioxide from making the bus, and the gradient m is the carbon dioxide released for each km in use. Find the gradient from two points far apart on the line, and read the crossing point carefully, remembering that the distance axis is in thousands of km. An LCA like this shows that a product with a larger manufacturing impact can still be better overall if it is used for long enough.

Mark scheme
  1. 1 mark

    60 000 km / 60 thousand km

    ALLOW 55 000 to 65 000 km. ALLOW 60 if the unit (thousand km) is clear from the answer.

  2. 1 mark

    the y-intercepts show the carbon dioxide released in making the buses (before they travel): more for the electric bus (110 t) than for the diesel bus (50 t)

    ALLOW for example because of making the electric bus's (large) battery. The comparison must be made for the mark.

  3. 1 mark

    the gradients show the carbon dioxide released for each km travelled (in use): the diesel bus's line is much steeper (1.25 t compared with 0.25 t for each 1000 km) (because it burns diesel)

    ALLOW the electric bus's carbon dioxide in use comes only from generating its electricity. ALLOW gradients from 1.2 to 1.3 and from 0.2 to 0.3 tonnes per thousand km. ALLOW gradients in kg per km (1.25 and 0.25).

  4. 1 mark

    after this distance, the electric bus has released less carbon dioxide in total, so over a long working life (for example 200 000 km: 160 t compared with 300 t) the electric bus is better

    ALLOW the extra carbon dioxide from making the electric bus is paid back after about 60 000 km. ALLOW ECF from the distance read from the graph.

Ready to try the rest? Every answer you write is marked against the mark scheme, so you can see exactly where the marks are.

Study Helper Hints first, answers after you try

Stuck on this one? Ask for a hint and I’ll point you in the right direction, without giving the answer away. Once you’ve checked your answer, I’ll show you how the marks are awarded.