Level:
Correct: 0
Incorrect: 0
Marks: 0/0
Exam Practice
Course:
Topics:
Edexcel GCSE Physics (Paper 2) Smart practice A mixed round aimed at your weak spots
Unit 1
Key concepts of physics
Unit 8
Energy - forces doing work
Unit 9
Forces and their effects
Unit 10
Electricity and circuits
Unit 11
Static electricity
Unit 12
Magnetism and the motor effect
Unit 13
Electromagnetic induction
Unit 14
Particle model
Unit 15
Forces and matter
Avg
score:
–
Topics
done:
0/34

Current-voltage graphs, LDRs and thermistors

Practise 15 exam-style questions on Current-voltage graphs, LDRs and thermistors for Edexcel GCSE Physics (Paper 2). Write your answer as you would in the exam and get it marked in seconds against the mark scheme, point by point, with the Study Helper on hand if you get stuck.

  • 15 questions
  • 1–6 marks each
  • Instant marking
  • No sign-up needed
15 questions, marked as you go

Sample questions with model answers

Here are 4 of the questions in this topic, each with a model answer, an explanation of why it earns the marks and the mark scheme an examiner would use.

Question 1

1 mark

The graph of current against potential difference for a fixed resistor at a constant temperature is a straight line through the origin.

What does this show about the resistor?

Choose your answer.

  • A its resistance increases as V increases
  • B its resistance decreases as V increases
  • C its resistance is constant
  • D it has no resistance

Model answer

C - its resistance is constant.

Explanation

A straight line through the origin means I ∝ V, so V ÷ I has the same value everywhere on the line. That ratio is the resistance, so the resistor obeys V = I × R with a constant R as long as its temperature does not change.

Mark scheme
  1. 1 mark

    C / its resistance is constant (1)

    The only correct answer is C: a straight line through the origin means the current is directly proportional to the potential difference, so V ÷ I (the resistance) is the same at every point. A is not correct because an increasing resistance gives a curve that gets less steep (like a filament lamp); B is not correct because a decreasing resistance gives a curve that gets steeper; D is not correct because a resistor with no resistance would have no potential difference across it for any current, so the graph could not be this line. Accept the letter or the option. If more than one option is given, do not award the mark.
Question 2

2 marks

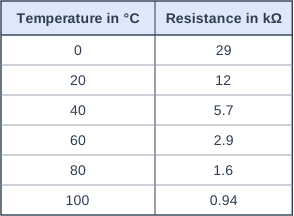
A student measures the resistance of a thermistor at different temperatures. The table shows the results.

A thermistor is most useful as a temperature sensor over the range where its resistance changes the most for each degree of temperature change.

Use the data to identify this range of temperatures. Justify your answer.

Table with columns "Temperature in °C", "Resistance in kΩ". Temperature in °C: 0; Resistance in kΩ: 29 | Temperature in °C: 20; Resistance in kΩ: 12 | Temperature in °C: 40; Resistance in kΩ: 5.7 | Temperature in °C: 60; Resistance in kΩ: 2.9 | Temperature in °C: 80; Resistance in kΩ: 1.6 | Temperature in °C: 100; Resistance in kΩ: 0.94.

Model answer

0 °C to 20 °C. In this range the resistance falls from 29 kΩ to 12 kΩ, a change of 17 kΩ, which is much larger than in any other 20 °C range - for example it only changes by 0.66 kΩ between 80 °C and 100 °C.

Explanation

The resistance of an NTC thermistor falls as the temperature rises, but not steadily: the fall is largest at low temperatures and gets smaller as the temperature rises. The best range for a sensor is where a small temperature change gives a large, easily measured change in resistance. Choosing the range with the largest resistance, rather than the largest change, is a common error.

Mark scheme
  1. 1 mark

    0 °C to 20 °C (1)

    accept 'at low temperatures / below 20 °C'.

  2. 1 mark

    the resistance falls by 17 kΩ between 0 °C and 20 °C, much more than for any other 20 °C interval (e.g. only 0.66 kΩ from 80 °C to 100 °C) (1)

    accept a correct comparison of the change in resistance, e.g. 'from 29 kΩ to 12 kΩ, compared with 12 kΩ to 5.7 kΩ from 20 °C to 40 °C'. accept 'the resistance changes by about 0.85 kΩ per °C' for 0-20 °C. The justification must use the data. Ignore 'the resistance is highest at 0 °C' (the size of the change matters, not the size of the resistance).

Question 3

3 marks

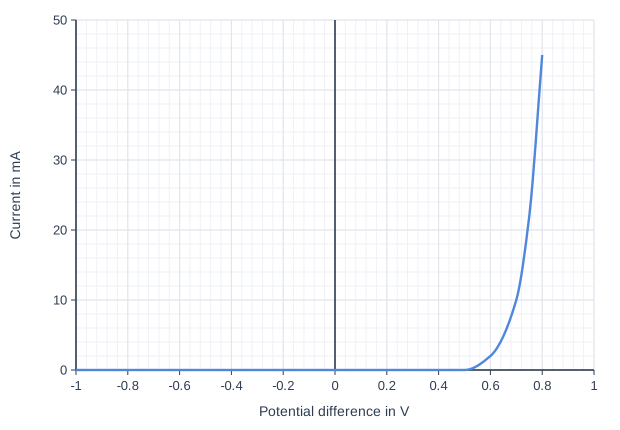
The graph shows how the current in a diode varies with the potential difference across it.

Describe how the resistance of the diode changes as the potential difference increases from −1.0 V to +0.8 V. Use data from the graph in your answer.

Line graph of current in mA (y-axis, 0 to 50) against Potential difference in V (x-axis, -1 to 1). The line is a smooth curve through (-1, 0), (0.5, 0), (0.6, 2), (0.7, 10), (0.75, 22), (0.8, 45).

Model answer

From −1.0 V up to about +0.5 V the current is zero, so the diode's resistance is very high. Above about 0.6 V the current increases very steeply, from 2 mA at 0.6 V to 45 mA at 0.8 V, so the resistance decreases rapidly: it is about 0.7 ÷ 0.010 = 70 Ω at 0.7 V and 0.8 ÷ 0.045 = 18 Ω at 0.8 V.

Explanation

A diode lets current pass in one direction only: in the reverse direction, and at small forward potential differences, its resistance is very high. Once the forward p.d. passes about 0.6 V, the current rises steeply, which means the resistance (V ÷ I) falls quickly. Describe the resistance, not just the current, to gain full marks.

Mark scheme
  1. 1 mark

    from −1.0 V to about +0.5 V the current is zero, so the resistance is very high (1)

    A description including the three points. accept 'infinite' for very high. accept 'for negative / reverse potential differences there is no current, so the resistance is very high' for this mark. accept 0.5 to 0.6 V for where the current starts.

  2. 1 mark

    above about 0.6 V the current increases rapidly / steeply (1)

    accept 'the current rises from 2 mA at 0.6 V to 45 mA at 0.8 V'.

  3. 1 mark

    so the resistance decreases (rapidly) as the potential difference increases above about 0.6 V (1)

    accept calculations showing the decrease, e.g. 0.7 ÷ 0.010 = 70 Ω and 0.8 ÷ 0.045 = 18 Ω. Do not accept 'the resistance increases' or 'the resistance is zero above 0.6 V'.

Question 4

4 marks

A thermistor is used to monitor the temperature of the air in a greenhouse at night. The potential difference across the thermistor is 6.0 V and the current in it is 2.0 mA.

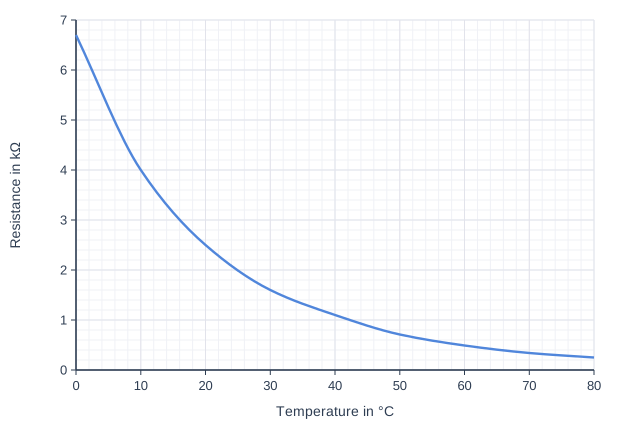
The graph shows how the resistance of the thermistor varies with temperature.

Calculate the resistance of the thermistor and use the graph to find the temperature of the air in the greenhouse.

Line graph of resistance in kΩ (y-axis, 0 to 7) against temperature in °C (x-axis, 0 to 80). The line is a smooth curve through (0, 6.7), (10, 4), (20, 2.5), (30, 1.6), (40, 1.1), (50, 0.71), (60, 0.49), (70, 0.34), (80, 0.25).

Model answer

I = 2.0 mA = 0.0020 A
V = I × R, so R = V ÷ I
R = 6.0 ÷ 0.0020 = 3000 Ω = 3.0 kΩ
From the graph, a resistance of 3.0 kΩ is at a temperature of 16 °C.

Explanation

Convert 2.0 mA to 0.0020 A, then R = V ÷ I gives 3000 Ω. The graph is in kΩ, so 3000 Ω is read at 3.0 kΩ, which is between the points at 10 °C (4.0 kΩ) and 20 °C (2.5 kΩ) - about 16 °C. Leaving the current in mA gives 3.0 Ω, and reading the graph at the wrong value of resistance is a common slip.

Mark scheme
  1. 1 mark

    conversion: 2.0 mA = 0.0020 A (1)

    accept 2.0 × 10⁻³ A. This mark can be seen in the substitution.

  2. 1 mark

    substitution and rearrangement: (R =) 6.0 ÷ 0.0020 (1)

    allow 6.0 = 0.0020 × R.

  3. 1 mark

    evaluation: 3000 (Ω) / 3.0 kΩ (1)

    Award full marks for the calculation (these three marks) for 3000 Ω or 3.0 kΩ without working. 3.0 (Ω), from leaving the current in mA, is a power of ten error and scores 2 of these three marks.

  4. 1 mark

    temperature: 16 (°C) (1)

    accept 15 to 17 (°C). allow ecf: the temperature read correctly from the graph for their resistance, if it is on the graph. A resistance of 3.0 Ω cannot be read from the graph, so a power of ten error cannot earn this mark unless the student reads the graph at 3.0 kΩ.

Ready to try the rest? Every answer you write is marked against the mark scheme, so you can see exactly where the marks are.

Study Helper Hints first, answers after you try

Stuck on this one? Ask for a hint and I’ll point you in the right direction, without giving the answer away. Once you’ve checked your answer, I’ll show you how the marks are awarded.