Level:
Correct: 0
Incorrect: 0
Marks: 0/0
Practice
Course:
Topics:
Year 5 Maths Smart practice A mixed round aimed at your weak spots
Unit 1
Place value
Number and place value
Numbers up to one million
Quick practice6 skills
Rounding whole numbers
Quick practice6 skills
Negative numbers
Quick practice6 skills
Roman numerals
Quick practice5 skills
Unit 2
Addition and subtraction
Unit 3
Multiplication and division
Unit 4
Fractions
Unit 5
Decimals and percentages
Unit 6
Measurement
Measurement
Converting metric units
Quick practice6 skills
Imperial units
Quick practice5 skills
Time
Quick practice5 skills
Money and measure problems
Quick practice4 skills
Perimeter
Quick practice5 skills
Area
Quick practice6 skills
Volume and capacity
Quick practice5 skills
Unit 7
Shape and angles
Unit 8
Position and direction
Geometry: position and direction
Coordinates
Quick practice5 skills
Reflection
Quick practice5 skills
Translation
Quick practice5 skills
Unit 9
Statistics
Avg
score:
–
Topics
done:
0/47

Tables, timetables and charts

Practise 20 questions on Tables, timetables and charts for Year 5 Maths. Tap your answer and find out straight away if you are right, with the Study Helper on hand if you get stuck.

  • 20 questions
  • 1–5 marks each
  • Instant marking
  • No sign-up needed
20 questions, marked as you go

Sample questions with model answers

Here are 4 of the questions in this topic, each with a model answer, an explanation of why it earns the marks and the mark scheme.

Question 1

1 mark

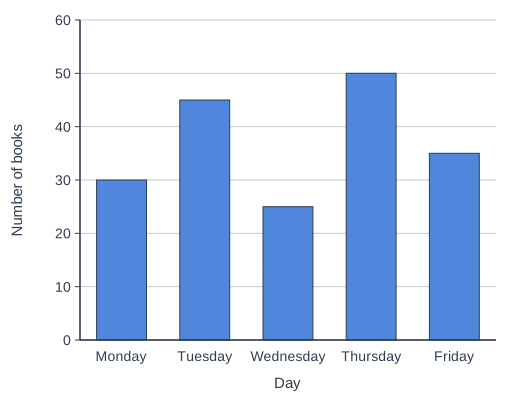
The bar chart shows the number of books borrowed from a school library each day last week.

How many books were borrowed on Wednesday?

A bar chart of the number of books borrowed from a school library on each day from Monday to Friday. The vertical axis, Number of books, goes from 0 to 60 and is numbered every 10, with a grid line at each number. The heights of the bars can be read from the scale.

Model answer

The Wednesday bar stops halfway between 20 and 30.
Halfway between 20 and 30 is 25.

Explanation

The numbers on the scale go up in 10s. The Wednesday bar stops exactly halfway between the 20 line and the 30 line, and halfway between 20 and 30 is 25. A common mistake is to think each gap is worth 1, or to read the nearest line instead.

Mark scheme
  1. 1 mark

    25

    Do not accept 20 or 30 (the nearest numbered line), or 2.5.

Question 2

2 marks

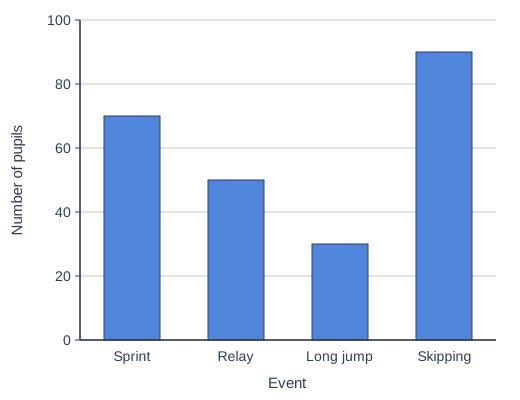
Each pupil at Hilltop School chose one event at sports day. The bar chart shows how many pupils chose each event.

How many pupils took part in sports day altogether?

A bar chart of the number of pupils who chose each sports day event: Sprint, Relay, Long jump and Skipping. The vertical axis, Number of pupils, goes from 0 to 100 and is numbered every 20, with a grid line at each number. The heights of the bars can be read from the scale.

Model answer

Sprint 70, Relay 50, Long jump 30, Skipping 90
\(70 + 50 + 30 + 90 = 240\)

Explanation

The numbered lines go up in 20s, so a bar that stops halfway between two of them is 10 more than the line below. For example, the Sprint bar is halfway between 60 and 80, which is 70. Then add all four bars. A common mistake is to think each gap on the scale is worth 10.

Mark scheme
  1. 1 mark

    At least three of the bars read correctly: Sprint 70, Relay 50, Long jump 30, Skipping 90; or the correct answer 240 with no working

  2. 1 mark

    240

    Do not accept 220 (the halfway bars read as 5 more than the line below, e.g. 65 for Sprint) or 120 (each gap on the scale read as 10). A correct answer with no working scores full marks.

Question 3

2 marks

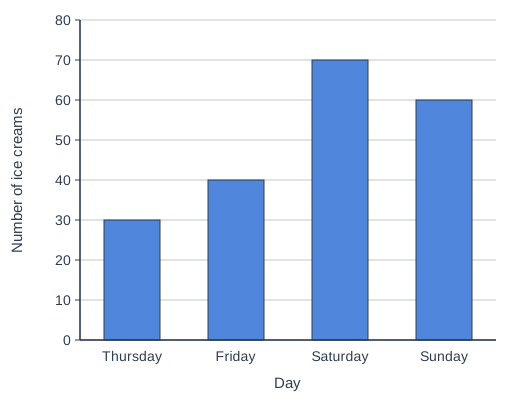
The bar chart shows how many ice creams a café sold on four days.

Ben says, "The café sold 3 more ice creams on Saturday than on Friday."

Is Ben right? How many more ice creams did the café sell on Saturday than on Friday?

A bar chart of the number of ice creams a café sold on Thursday, Friday, Saturday and Sunday. The vertical axis, Number of ice creams, goes from 0 to 80 and is numbered every 10, with a grid line at each number. The heights of the bars can be read from the scale.

Model answer

No. Friday's bar is at 40 and Saturday's bar is at 70. \(70 - 40 = 30\), so the café sold 30 more ice creams on Saturday, not 3.

Explanation

Ben has counted the 3 gaps between the tops of the bars, but each gap on the scale is worth 10 ice creams, not 1. Read each bar from the scale and subtract: \(70 - 40 = 30\). Always check what each line on the scale is worth before you read a bar chart.

Mark scheme
  1. 1 mark

    No, with a relevant but incomplete reason, e.g. 'each line is worth 10, not 1' or 'it is a lot more than 3'

    'No' alone scores 0. 'Yes' scores 0 for both marks.

  2. 1 mark

    No, with a complete correct reason: Friday is 40 and Saturday is 70, so the café sold \(70 - 40 = 30\) more ice creams

    Accept 'it sold 30 more, because the scale goes up in 10s'. A complete correct reason on its own scores both marks.

Question 4

4 marks

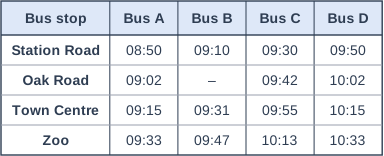
The table shows part of a bus timetable. A dash (–) means that the bus does not stop there.

Sam gets to the Oak Road bus stop at 09:20. He wants to go to the Zoo.

How many minutes does Sam wait at Oak Road for the next bus?

How many minutes is his bus journey from Oak Road to the Zoo?

Table with columns "Bus stop", "Bus A", "Bus B", "Bus C", "Bus D". Bus stop: Station Road; Bus A: 08:50; Bus B: 09:10; Bus C: 09:30; Bus D: 09:50 | Bus stop: Oak Road; Bus A: 09:02; Bus B: –; Bus C: 09:42; Bus D: 10:02 | Bus stop: Town Centre; Bus A: 09:15; Bus B: 09:31; Bus C: 09:55; Bus D: 10:15 | Bus stop: Zoo; Bus A: 09:33; Bus B: 09:47; Bus C: 10:13; Bus D: 10:33.

Model answer

Bus B does not stop at Oak Road (it has a dash).
The next bus is Bus C at 09:42.
Wait: 09:20 to 09:42 is 22 minutes.
Bus C gets to the Zoo at 10:13.
09:42 to 10:00 is 18 minutes, and 10:00 to 10:13 is 13 minutes.
Journey: \(18 + 13 = 31\) minutes

Explanation

Read along the Oak Road row and find the first time after 09:20. The dash for Bus B means it goes past without stopping, so Sam must wait for Bus C at 09:42. Then follow Bus C's column down to the Zoo row and count on from 09:42 to 10:13, using 10:00 as a stepping stone. A common mistake is to choose Bus B without noticing the dash.

Mark scheme
  1. 1 mark

    The next bus that stops at Oak Road found: Bus C at 09:42; or the correct answer 22 minutes with no working

  2. 1 mark

    Wait: 22 minutes

    Do not accept an answer based on Bus B, which does not stop at Oak Road.

  3. 1 mark

    Bus C reaches the Zoo at 10:13, or a correct counting-on method for their bus; or the correct answer 31 minutes with no working

  4. 1 mark

    Journey: 31 minutes

    Follow through from their bus if it stops at Oak Road after 09:20. Do not accept 71 (from 1013 − 942). A correct answer with no working scores full marks.

Ready to try the rest? Tap your answers and see straight away how you did.

Topic notes

Tables, timetables and charts

The big idea

When people count or measure things, such as how many bikes are hired or when each train leaves, the results are called data. Tables and charts set data out neatly, so you can find a number quickly and compare numbers. First find exactly the right number; then add, subtract or compare to get your answer.

Tallies and two-way tables

A tally chart keeps count while you watch or ask: draw one line for each thing you count. The fifth line is drawn as a slash through the first four, so each group of five looks like a little gate. Count the gates in 5s and then count on the single lines: three gates and 2 single lines show \(15 + 2 = 17\). The number counted for each thing is called its frequency.

A two-way table splits the data by two things at once, such as class and whether a child has a pet. The numbers along a row add to make the total at the end of that row, and each column's numbers add to make the total at the bottom.

Has a petNo petTotal
Class 5A171330
Class 5B?928
Total362258

To fill a gap, use a row or column where only one number is missing. The Class 5B row must make 28, so the gap is \(28 - 9 = 19\). The "Has a pet" column agrees: \(36 - 17 = 19\).

Timetables

A timetable says when things happen, such as the lessons in a school day or the times of buses. In a bus or train timetable, each stop usually has a row and each journey a column: to follow one train, run your finger down its column. Times use the 24-hour clock, so 14:05 is 5 minutes past 2 in the afternoon.

For a journey time, count on: first to the next o'clock, then on to the end time. Do not subtract times like whole numbers: an hour has 60 minutes, not 100.

Which of these trains has the shortest journey from Hollin to Westby?

StationTrain 1Train 2Train 3
Hollin07:5008:1508:40
Cobb Hill08:1208:3309:05
Westby08:3408:5209:31

Only the Hollin and Westby rows matter. Follow each train down its column.

  • Train 1: 07:50 to 08:00 is 10 minutes, and 08:00 to 08:34 is 34 minutes. \(10 + 34 = 44\) minutes.
  • Train 2: 08:15 to 08:52 is \(52 - 15 = 37\) minutes (no o'clock to cross).
  • Train 3: 08:40 to 09:00 is 20 minutes, and 09:00 to 09:31 is 31 minutes. \(20 + 31 = 51\) minutes.

37 minutes is the shortest time, so the answer is Train 2.

Bar charts

The taller the bar, the bigger the number it shows. Before reading any bar, work out the scale: how much the numbers go up by from one line to the next. If the top of a bar is midway between two lines, read the number midway between theirs.

Four groups picked up litter on a beach. Which group picked up twice as many pieces as Group A?

Bar chart of pieces of litter for each group: Group A 15, Group B 20, Group C 30, Group D 35.
The numbered lines go up in 10s (the faint lines go up in 2s). A bar whose top is midway between two numbered lines is 5 more than the lower line.

Read Group A first. The top of its bar is midway between 10 and 20, so Group A picked up 15 pieces.

Twice as many as 15 is \(15 \times 2 = 30\).

Group C's bar ends exactly on the 30 line. (Group D's ends midway between 30 and 40, at 35.) So the answer is Group C.

Pictograms

In a pictogram, symbols stand for amounts. The key says how many one full symbol is worth. Half a symbol is worth half of that, and a quarter of a symbol a quarter of it.

This pictogram shows how many bikes were hired at a park. The number in the key has been rubbed out. On Monday 42 bikes were hired. What does one circle stand for? How many bikes were hired on Wednesday?

Pictogram titled "Bikes hired at the park", a table with 4 rows of circle symbols. Key: one circle represents 14 bikes (the number is left blank on the key: students work it out). Monday: 3 circles = 42 bikes. Tuesday: 4 circles = 56 bikes. Wednesday: 3 and a half circles = 49 bikes. Thursday: 1 and a half circles = 21 bikes. Total of the rows that are drawn: 168 bikes.
Monday has 3 whole circles. Wednesday has 3 whole circles and a half circle.

Monday: 3 circles stand for 42 bikes, so one circle stands for \(42 \div 3 = 14\) bikes.

Wednesday: 3 whole circles, the same as Monday, stand for 42 bikes. Half a circle is half of 14, which is 7 bikes. So \(42 + 7 = 49\) bikes were hired on Wednesday.

Common mistakes

  • Counting a tally gate as 4. The slash through it is the fifth mark.
  • Counting the squares a bar covers instead of using the numbers on the scale.
  • Ignoring the half and quarter symbols in a pictogram.
  • Finding a journey time by taking 07:50 from 08:34 like whole numbers. The answer is 44 minutes, not 84.

Top tip

Read the title, labels and key or scale first. Then lay a ruler along the row or bar you are reading.

Study Helper Hints first, answers after you try

Stuck on this one? Ask for a hint and I’ll point you in the right direction, without giving the answer away. Once you’ve checked your answer, I’ll show you how the marks are awarded.