Level:
Correct: 0
Incorrect: 0
Marks: 0/0
Practice
Course:
Topics:
Year 5 Maths Smart practice A mixed round aimed at your weak spots
Unit 1
Place value
Number and place value
Numbers up to one million
Quick practice6 skills
Rounding whole numbers
Quick practice6 skills
Negative numbers
Quick practice6 skills
Roman numerals
Quick practice5 skills
Unit 2
Addition and subtraction
Unit 3
Multiplication and division
Unit 4
Fractions
Unit 5
Decimals and percentages
Unit 6
Measurement
Measurement
Converting metric units
Quick practice6 skills
Imperial units
Quick practice5 skills
Time
Quick practice5 skills
Money and measure problems
Quick practice4 skills
Perimeter
Quick practice5 skills
Area
Quick practice6 skills
Volume and capacity
Quick practice5 skills
Unit 7
Shape and angles
Unit 8
Position and direction
Geometry: position and direction
Coordinates
Quick practice5 skills
Reflection
Quick practice5 skills
Translation
Quick practice5 skills
Unit 9
Statistics
Avg
score:
–
Topics
done:
0/47

Line graphs

Practise 20 questions on Line graphs for Year 5 Maths. Tap your answer and find out straight away if you are right, with the Study Helper on hand if you get stuck.

  • 20 questions
  • 1–5 marks each
  • Instant marking
  • No sign-up needed
20 questions, marked as you go

Sample questions with model answers

Here are 4 of the questions in this topic, each with a model answer, an explanation of why it earns the marks and the mark scheme.

Question 1

1 mark

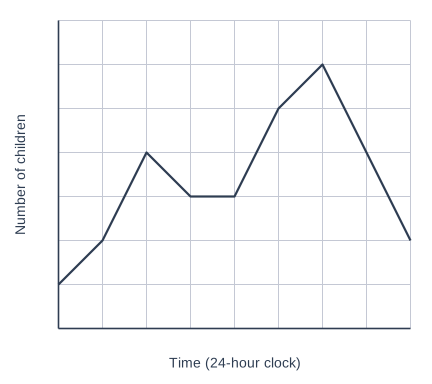
The line graph shows the number of children in a park playground at each hour from 09:00 to 17:00.

At what time were there the most children in the playground?

A graph of Number of children (vertical axis, 0 to 35, marked every 5) against Time (24-hour clock) (horizontal axis, 9 to 17, marked every 1), on a grid. The graph is made of straight-line sections; its values can be read from the grid.

Model answer

The highest point of the line is above 15 on the time axis, so there were the most children at 15:00.

Explanation

The most children is shown by the highest point on the line. Find the highest point of the line, then go straight down to the time axis: it is at 15, which means 15:00 (3 pm). A common mistake is to give the number of children instead of the time.

Mark scheme
  1. 1 mark

    15:00

    Accept 3 pm, 3:00 pm or 15. Do not accept 30 (the number of children) or 17:00 (the end of the graph).

Question 2

2 marks

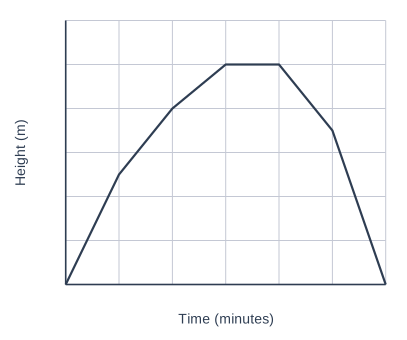
The line graph shows the height of a hot-air balloon during a flight.

How much higher was the balloon after 30 minutes than after 10 minutes?

A graph of Height (m) (vertical axis, 0 to 600, marked every 100) against Time (minutes) (horizontal axis, 0 to 60, marked every 10), on a grid. The graph is made of straight-line sections; its values can be read from the grid.

Model answer

After 10 minutes: 250 m (halfway between 200 and 300)
After 30 minutes: 500 m
\(500 - 250 = 250\) m higher

Explanation

Read the height at each time, then find the difference by subtracting the smaller height from the bigger one. The scale goes up in 100s, so halfway between 200 and 300 is 250. A common mistake is to read 25 or 205 at 10 minutes.

Mark scheme
  1. 1 mark

    Both heights read correctly: 250 m after 10 minutes and 500 m after 30 minutes; or the correct answer 250 m with no working

  2. 1 mark

    250 m

    The unit is not needed. Follow through from their two readings. A correct answer with no working scores full marks.

Question 3

2 marks

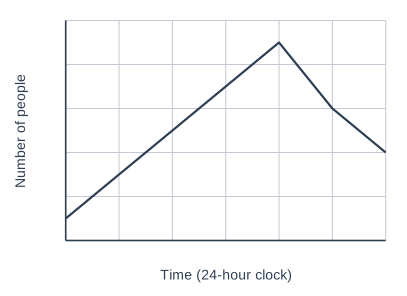
The line graph shows the number of people at a city farm at each hour from 09:00 to 15:00.

Lily says, "There were 40 more people at the farm at 12:00 than at 10:00."

How many people were at the farm at 10:00, and how many at 12:00? Is Lily right?

A graph of Number of people (vertical axis, 0 to 100, marked every 20) against Time (24-hour clock) (horizontal axis, 9 to 15, marked every 1), on a grid. The graph is made of straight-line sections; its values can be read from the grid.

Model answer

Yes. At 10:00 there were 30 people (halfway between 20 and 40). At 12:00 there were 70 people (halfway between 60 and 80). \(70 - 30 = 40\), so there were 40 more people.

Explanation

Read the graph at both times. The scale goes up in 20s, so both readings are halfway between numbered lines: 30 and 70. The difference is \(70 - 30 = 40\), so Lily is right. A common mistake is to think each gap is worth 10.

Mark scheme
  1. 1 mark

    Yes, with a relevant but incomplete reason, e.g. one of the two readings correct, or 'the line goes up 2 squares' without saying what a square is worth

    'Yes' alone scores 0. 'No' scores 0 for both marks.

  2. 1 mark

    Yes, with a complete correct reason: 30 people at 10:00 and 70 people at 12:00, and \(70 - 30 = 40\)

    Accept 'the line goes up 2 squares and each square is 20 people, so 40 more'. A complete correct reason on its own scores both marks.

Question 4

4 marks

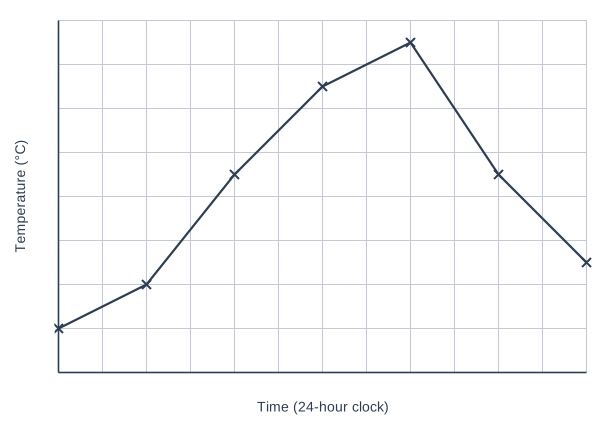
Zainab measured the temperature inside her tent every 2 hours on a camping trip. The line graph shows her results.

How many degrees did the temperature rise from 06:00 to the highest temperature?

Between which two of her readings did the temperature fall fastest?

Use the graph to estimate the temperature at 13:00.

A graph of Temperature (°C) (vertical axis, 0 to 16, marked every 2) against Time (24-hour clock) (horizontal axis, 6 to 18, marked every 1), on a grid. The graph is made of straight-line sections; its values can be read from the grid. A cross is marked on the grid; its coordinates can be read from the grid. A cross is marked on the grid; its coordinates can be read from the grid. A cross is marked on the grid; its coordinates can be read from the grid. A cross is marked on the grid; its coordinates can be read from the grid. A cross is marked on the grid; its coordinates can be read from the grid. A cross is marked on the grid; its coordinates can be read from the grid. A cross is marked on the grid; its coordinates can be read from the grid.

Model answer

At 06:00: 2 °C. Highest: 15 °C at 14:00.
\(15 - 2 = 13\) degrees
The steepest fall is from 14:00 to 16:00 (15 °C to 9 °C, 6 degrees).
At 13:00 the line is at 14 °C.

Explanation

Find the highest cross and read it, then subtract the 06:00 reading to find the rise. The temperature fell fastest where the line slopes down most steeply. For 13:00, which is between two readings, go up from 13 to the line and across: 14 °C, halfway between 13 °C and 15 °C. A common mistake is to read the scale as going up in 1s when it goes up in 2s.

Mark scheme
  1. 1 mark

    The highest temperature read correctly as 15 °C (at 14:00), with 2 °C at 06:00; or the correct answer 13 degrees with no working

  2. 1 mark

    13 degrees

    \(15 - 2 = 13\). The unit is not needed. Follow through from their readings.

  3. 1 mark

    Between 14:00 and 16:00

    It fell 6 degrees (15 to 9). Do not accept 16:00 to 18:00 (a fall of 4 degrees).

  4. 1 mark

    14 °C

    The unit is not needed. The line crosses the 14 line exactly at 13:00. A correct answer with no working scores full marks.

Ready to try the rest? Tap your answers and see straight away how you did.

Topic notes

Line graphs

The big idea

Measure the same thing again and again, such as the temperature of a hot drink as it cools, and you get a set of readings. A line graph plots each reading as a point and joins the points with straight lines. The shape of the line tells the story: where it climbs, the amount is growing; where it falls, the amount is shrinking; where it is flat, nothing is changing.

Reading a line graph

The axis going across usually shows time. The axis going up shows what was measured. Read both axis labels and their units first.

Next, work out the scale. Take any two neighbouring numbered lines, subtract their numbers, and share the answer between the squares that separate them. For example, if the numbered lines count in 10s with 2 squares between them, each square is worth 5.

  • The value at a time: start at the time, move straight up until you hit the line, and then move straight across to read the scale.
  • The time for a value: start at the value on the scale, move across until you hit the line, and then drop down to the time axis.

Comparing readings

  • How much it changed: read both values and subtract the smaller one from the bigger one.
  • Highest or lowest: find the highest or lowest point on the line.
  • Changing fastest: look for where the line is steepest. A steep slope means a big change in a short time.
  • Between readings: the line between two points lets you estimate a value nobody measured.

Mia makes a hot chocolate and measures its temperature every 2 minutes. What was the temperature after 4 minutes? How much did it cool down in the first 6 minutes? When was it cooling fastest?

A graph of Temperature (°C) (vertical axis, 0 to 90, marked every 10) against Time (minutes) (horizontal axis, 0 to 12, marked every 2), on a grid with 2 small squares to each large square. The graph is made of straight-line sections joining (0, 80), (2, 65), (4, 55), (6, 45), (8, 40), (10, 35) and (12, 30). (Gradients of the sections from left to right: −15/2, −5, −5, −5/2, −5/2, −5/2.) A cross is marked at (0, 80). A cross is marked at (2, 65). A cross is marked at (4, 55). A cross is marked at (6, 45). A cross is marked at (8, 40). A cross is marked at (10, 35). A cross is marked at (12, 30).
The crosses are Mia's readings. The numbered lines on the temperature axis go up in 10s, with 2 small squares between them, so each small square is 5 °C.

After 4 minutes: find 4 minutes along the bottom, move up to the line, then across. The line is halfway between 50 and 60, so it was 55 °C.

First 6 minutes: it started at 80 °C and was 45 °C after 6 minutes. \(80 - 45 = 35\), so it cooled by 35 °C.

Fastest: the line is steepest in the first 2 minutes, from 80 °C down to 65 °C. That is a fall of 15 °C, more than in any other 2 minutes. It was cooling fastest at the start.

Use the same graph. Estimate the temperature after 5 minutes.

Mia did not measure at 5 minutes, but 5 is halfway between her readings at 4 minutes (55 °C) and 6 minutes (45 °C).

Go up from 5 to the line and across: it meets halfway between 55 and 45, which is about 50 °C.

This is an estimate, because the drink may not have cooled at exactly the same rate between the two readings.

Two lines on one graph

A graph can show two sets of readings, so you can compare them. A label or a key tells you which line is which. Where the lines cross, the two values are the same. The gap between the lines at any time is the difference between them.

Sal and Sid are snails in a race along a 60 cm track. The graph shows how far each snail had gone. Who was ahead after 3 minutes, and by how much? When were they level? Who won?

A graph of Distance (cm) (vertical axis, 0 to 60, marked every 10) against Time (minutes) (horizontal axis, 0 to 7, marked every 1), on a grid with 2 small squares to each large square. Graph Sal is made of straight-line sections joining (0, 0), (1, 10), (2, 20), (3, 30), (4, 40), (5, 50) and (6, 60). (Gradients of the sections from left to right: 10, 10, 10, 10, 10, 10.) Graph Sid is made of straight-line sections joining (0, 0), (1, 15), (2, 30), (3, 35), (4, 40), (5, 45), (6, 50) and (7, 60). (Gradients of the sections from left to right: 15, 15, 5, 5, 5, 5, 10.) Graph Sal and graph Sid cross at (0, 0) and (4, 40).
Sal's line is solid and Sid's line is dashed. Each small square on the distance axis is 5 cm.

After 3 minutes: Sid's dashed line is at 35 cm, halfway between 30 and 40. Sal's solid line is at 30 cm. Sid was ahead by \(35 - 30 =\) 5 cm.

Level: the lines cross at 4 minutes, when both snails had gone 40 cm.

Winner: Sal's line reaches 60 cm at 6 minutes, but Sid's does not get there until 7 minutes. Sal won, even though Sid started faster.

Common mistakes

  • Reading the nearest numbered line instead of working out a value between two lines.
  • Answering "how much did it change?" with a single reading. A change needs a subtraction.
  • Thinking a flat line means the amount was 0. It means the amount stayed the same.
  • Picking the highest point when the question asks when something changed fastest. Look for the steepest slope.

Top tip

Before you start, decide what the question wants: a reading, a time, a change or a comparison. Underline it, and check your answer is that kind of thing.

Study Helper Hints first, answers after you try

Stuck on this one? Ask for a hint and I’ll point you in the right direction, without giving the answer away. Once you’ve checked your answer, I’ll show you how the marks are awarded.