
Level:
Correct: 0
Incorrect: 0
Marks: 0/0
Exam Practice
Course:
Topics:
AQA GCSE Food Preparation and Nutrition Smart practice A mixed round aimed at your weak spots
Unit 1
Food preparation skills
Unit 2
Food, nutrition and health
Unit 3
Food science
Unit 4
Food safety
Unit 5
Food choice
Unit 6
Food provenance
Avg
score:
–
Topics
done:
0/37

How to carry out nutritional analysis

Practise 20 exam-style questions on How to carry out nutritional analysis for AQA GCSE Food Preparation and Nutrition. Write your answer as you would in the exam and get it marked in seconds against the mark scheme, point by point, with the Study Helper on hand if you get stuck.

  • 20 questions
  • 1–12 marks each
  • Instant marking
  • No sign-up needed
20 questions, marked as you go

Sample questions with model answers

Here are 4 of the questions in this topic, each with a model answer, an explanation of why it earns the marks and the mark scheme an examiner would use.

Question 1

1 mark

A nutritional analysis shows that one portion of a chicken and vegetable pasta bake provides only 4 g of fibre.

Which change to the recipe would increase its fibre content?

Choose your answer.

  • Skinless chicken breast instead of chicken thighs
  • Semi-skimmed milk instead of whole milk
  • Wholewheat pasta instead of white pasta
  • Reduced-fat Cheddar instead of full-fat Cheddar

Model answer

Wholewheat pasta instead of white pasta

Explanation

Fibre is found only in plant foods, and wholegrain cereals keep the bran, so wholewheat pasta adds far more fibre than white pasta. The other three swaps change animal foods that contain no fibre, so they make the dish lower in fat or saturated fat instead. A common mistake is to pick any 'healthier' swap without checking which nutrient it changes.

Mark scheme
  1. 1 mark

    Wholewheat pasta instead of white pasta

    If more than one option is given, 0 marks. Dried wholewheat pasta has roughly three times the fibre of white pasta (about 9 g compared with about 3 g per 100 g). Chicken, milk and cheese contain no fibre: those swaps lower fat or saturated fat, not raise fibre.
Question 2

3 marks

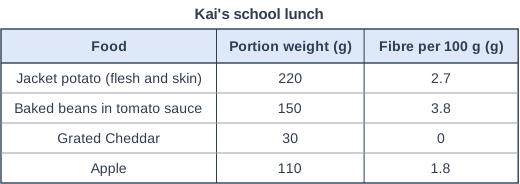
Kai is 15. In the school canteen he chooses a jacket potato with baked beans and grated cheese, and an apple, for lunch. The table shows the fibre in each food.

Fibre in a food = fibre per 100 g × portion weight ÷ 100
Percentage of guideline = fibre in the lunch ÷ daily guideline × 100

The fibre guideline for 11-16 year olds is 25 g a day.

Calculate the total fibre in Kai's lunch and the percentage of his daily fibre guideline that it provides. Show your working.

Kai's school lunch. Table with columns "Food", "Portion weight (g)", "Fibre per 100 g (g)". Food: Jacket potato (flesh and skin); Portion weight (g): 220; Fibre per 100 g (g): 2.7 | Food: Baked beans in tomato sauce; Portion weight (g): 150; Fibre per 100 g (g): 3.8 | Food: Grated Cheddar; Portion weight (g): 30; Fibre per 100 g (g): 0 | Food: Apple; Portion weight (g): 110; Fibre per 100 g (g): 1.8.

Model answer

Jacket potato: 220 × 2.7 ÷ 100 = 5.94 g
Baked beans: 150 × 3.8 ÷ 100 = 5.7 g
Grated Cheddar: 30 × 0 ÷ 100 = 0 g
Apple: 110 × 1.8 ÷ 100 = 1.98 g
Total = 13.62 g, about 13.6 g
Percentage = 13.62 ÷ 25 × 100 = 54.5% of Kai's daily guideline

Explanation

Each food's fibre is scaled from its per-100 g value to the portion eaten, then the foods are added. The lunch gives just over half of Kai's 25 g, mostly from the potato with its skin and the beans; cheese, like all animal foods, has no fibre. A common mistake is to add the per-100 g values (8.3 g) instead of scaling each one to its portion.

Mark scheme
  1. 1 mark

    fibre in each food: jacket potato 5.94 g, baked beans 5.7 g, grated Cheddar 0 g, apple 1.98 g

    Award 1 mark for each correct step as shown. Award full marks for the correct answers with or without working. Credit this mark if the potato, beans and apple values are correct.

  2. 1 mark

    total fibre = 13.62 g (about 13.6 g)

    Accept 13.6 to 13.7 g. ecf: the sum of their values for the four foods. Do not credit 8.3 g (the per-100 g values added without scaling).

  3. 1 mark

    percentage = 13.62 ÷ 25 × 100 = 54.5%

    Accept 54% to 55%. ecf from their total. Do not credit 45.4% (the adult guideline of 30 g used instead of 25 g).

Question 3

4 marks

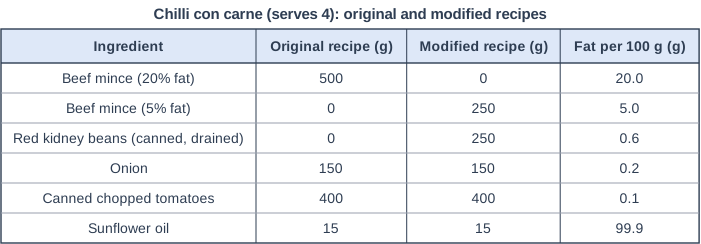
Ffion has modified her chilli con carne recipe to reduce its fat content. She replaced the beef mince with a smaller amount of lower-fat mince and some red kidney beans. Both recipes serve 4. The table shows the ingredients and their fat content.

Fat in an ingredient = fat per 100 g × weight used ÷ 100

Calculate how much less fat there is in one portion of the modified chilli than in one portion of the original chilli. Show your working.

Chilli con carne (serves 4): original and modified recipes. Table with columns "Ingredient", "Original recipe (g)", "Modified recipe (g)", "Fat per 100 g (g)". Ingredient: Beef mince (20% fat); Original recipe (g): 500; Modified recipe (g): 0; Fat per 100 g (g): 20.0 | Ingredient: Beef mince (5% fat); Original recipe (g): 0; Modified recipe (g): 250; Fat per 100 g (g): 5.0 | Ingredient: Red kidney beans (canned, drained); Original recipe (g): 0; Modified recipe (g): 250; Fat per 100 g (g): 0.6 | Ingredient: Onion; Original recipe (g): 150; Modified recipe (g): 150; Fat per 100 g (g): 0.2 | Ingredient: Canned chopped tomatoes; Original recipe (g): 400; Modified recipe (g): 400; Fat per 100 g (g): 0.1 | Ingredient: Sunflower oil; Original recipe (g): 15; Modified recipe (g): 15; Fat per 100 g (g): 99.9.

Model answer

Original: beef mince (20% fat) 500 × 20.0 ÷ 100 = 100 g of fat
Modified: beef mince (5% fat) 250 × 5.0 ÷ 100 = 12.5 g; kidney beans 250 × 0.6 ÷ 100 = 1.5 g; total 14 g of fat
The onion, tomatoes and oil are the same in both recipes, so they do not change the difference.
Difference = 100 - 14 = 86 g for the whole recipe
Per portion = 86 ÷ 4 = 21.5 g less fat in each portion

Explanation

Only the changed ingredients affect the difference, so compare the fat from the original mince with the fat from the lower-fat mince plus the beans, then divide by the 4 portions. Each portion now has 21.5 g less fat (about 7.4 g instead of 28.9 g). A common mistake is to forget the beans or to give the difference for the whole recipe.

Mark scheme
  1. 1 mark

    fat from the original mince = 500 × 20.0 ÷ 100 = 100 g (or original recipe total 115.7 g)

    Award 1 mark for each correct step as shown. Award full marks for the correct answer with or without working. The onion, tomatoes and oil are the same in both recipes, so they may be left out, or included in both totals (onion 0.3 g, tomatoes 0.4 g, oil 14.985 g).

  2. 1 mark

    fat from the lower-fat mince and beans = 12.5 + 1.5 = 14 g (or modified recipe total 29.7 g)

  3. 1 mark

    difference for the whole recipe = 100 - 14 = 86 g

    Also from 115.7 - 29.7 = 86 g. ecf from their totals.

  4. 1 mark

    difference per portion = 86 ÷ 4 = 21.5 g less fat

    Also from 28.9 - 7.4 = 21.5 g per portion. ecf: their difference ÷ 4. If the beans' fat is left out (87.5 g for the recipe, 21.9 g per portion), award 3 marks. Do not credit 86 g as the final answer (the whole recipe, not one portion).

Question 4

6 marks

A secondary school cook is developing a new main course for the canteen: chicken and vegetable pie with mashed potato.

Explain how the cook could use nutritional analysis to develop the recipe so that it meets healthy eating guidelines for students aged 11-16.

Model answer

First the cook would weigh every ingredient in the pie and the mash, enter the weights and the number of portions into nutritional analysis software, and work out the energy and nutrients in one portion. She would compare a portion with the dietary reference values for 11-16 year olds. Because lunch is one of three main meals, it should give roughly a third of the day's needs, for example about 8 g of the 25 g fibre guideline and no more than about 2 g of salt.

The results would show which nutrients are too high or too low. Shortcrust pastry made with butter, and butter and whole milk in the mash, would make the saturated fat high, so she could use a pastry lid only, make the pastry with half wholemeal flour and an unsaturated spread, and use semi-skimmed milk. A stock cube would make the salt high, so she could use reduced-salt stock with herbs and pepper. To raise fibre and iron she could add more vegetables and some lentils to the filling and leave the skins on the potatoes.

She would then re-analyse the modified recipe and compare it with the original to check the changes had worked, and finally run a taste test with students so they still choose and enjoy the healthier pie.

Explanation

Top-level answers explain the whole process in order: enter accurate weights and portions, compare with the right reference values for teenagers, use the results to pick out specific nutrients to change, modify named ingredients and then re-analyse to check. Linking each change to the nutrient it improves lifts an answer into Level 3. Common pitfalls are listing healthy swaps without saying how the analysis is used, or comparing with adult values without considering that lunch is only part of the day.

Mark scheme
  1. 6 marks

    Levels of response (6 marks). AO2.
    Level 3 (5-6 marks): Responses show very good knowledge and understanding of how nutritional analysis is used to plan and modify recipes. Detailed and factual explanations related to developing the school's chicken and vegetable pie.
    Level 2 (3-4 marks): Responses show good knowledge and understanding of how nutritional analysis is used to plan and modify recipes. Factual explanations, some of which relate to developing the school's chicken and vegetable pie.
    Level 1 (1-2 marks): Responses show limited knowledge and understanding of how nutritional analysis is used to plan and modify recipes. Limited explanation related to developing the school's chicken and vegetable pie.
    0 marks: nothing to reward.

    Indicative content (not a checklist; credit other valid points): weigh every ingredient in the pie and mash and enter the weights, and the number of portions, into nutritional analysis software (or use food composition tables) to work out the energy and nutrients in one portion; compare one portion with the dietary reference values for 11-16 year olds, or with about a third of the daily values because lunch is one of three main meals (e.g. fibre 25 g a day, so about 8 g; salt no more than 6 g a day, so about 2 g; free sugars no more than 30 g a day; fat 35% or less of energy); identify nutrients that are too high (fat and saturated fat from butter in the pastry and mash, whole milk, chicken skin; salt from stock cubes and added salt) and too low (fibre, iron, calcium, vitamin C); modify the recipe: a pastry lid only instead of a top and bottom crust, or a mashed potato or filo topping; half wholemeal flour in the pastry for fibre; an unsaturated spread or oil instead of butter; skinless chicken breast; more vegetables, or lentils or beans added to the filling, for fibre, iron and 5 A Day; reduced-salt stock with herbs, garlic or pepper instead of salt; semi-skimmed milk in the sauce and mash; potato skins left on; serve with an extra portion of vegetables; check the portion size suits teenagers' energy needs for growth and activity; re-analyse the modified recipe and compare it with the original to check that each change worked, repeating until the targets are met; carry out sensory testing with students so the healthier pie is still chosen and eaten; check the cost per portion; remember the analysis is an estimate (average database values, cooking losses), so weigh accurately and choose the closest foods in the database. Any other relevant and correct response can be credited.

Ready to try the rest? Every answer you write is marked against the mark scheme, so you can see exactly where the marks are.

Study Helper Hints first, answers after you try

Stuck on this one? Ask for a hint and I’ll point you in the right direction, without giving the answer away. Once you’ve checked your answer, I’ll show you how the marks are awarded.