Level:
Correct: 0
Incorrect: 0
Marks: 0/0
Practice
Course:
Topics:
Year 3 Maths Smart practice A mixed round aimed at your weak spots
Unit 1
Place value
Unit 2
Addition and subtraction
Unit 3
Multiplication and division
Unit 4
Fractions
Unit 5
Measurement
Measurement
Length
Quick practice5 skills
Perimeter
Quick practice5 skills
Mass
Quick practice5 skills
Capacity and volume
Quick practice5 skills
Money
Quick practice5 skills
Telling the time
Quick practice6 skills
Units of time and durations
Quick practice6 skills
Unit 6
Geometry
Unit 7
Statistics
Avg
score:
–
Topics
done:
0/36

Bar charts

Practise 20 questions on Bar charts for Year 3 Maths. Tap your answer and find out straight away if you are right, with the Study Helper on hand if you get stuck.

  • 20 questions
  • 1–4 marks each
  • Instant marking
  • No sign-up needed
20 questions, marked as you go

Sample questions with model answers

Here are 4 of the questions in this topic, each with a model answer, an explanation of why it earns the marks and the mark scheme.

Question 1

1 mark

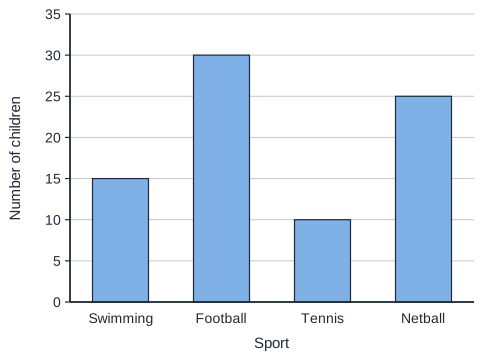
The bar chart shows the sports that children chose.

Which sport is the least popular?

A bar chart of the sports children chose: Swimming, Football, Tennis and Netball. The vertical axis, Number of children, goes from 0 to 35 and is numbered every 5, with a grid line at each number. The heights of the bars can be read from the scale.

Model answer

Tennis has the shortest bar, so it is the least popular.

Explanation

Least popular means the fewest children chose it, so look for the shortest bar. A common mistake is to choose the tallest bar by reading the word 'least' too quickly.

Mark scheme
  1. 1 mark

    Tennis

    Accept 'Tennis, 10'. Do not accept 10 on its own.

Question 2

2 marks

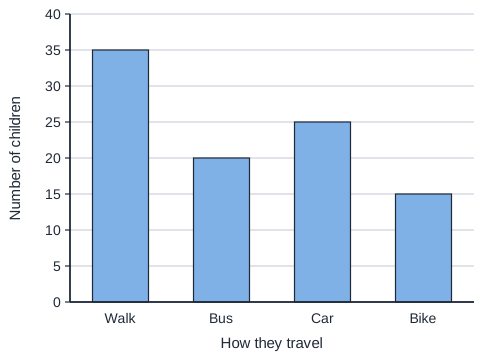
The bar chart shows how children travel to school.

How many more children walk than ride a bike?

A bar chart of how children travel: Walk, Bus, Car and Bike. The vertical axis, Number of children, goes from 0 to 40 and is numbered every 5, with a grid line at each number. The heights of the bars can be read from the scale.

Model answer

Walk: 35. Bike: 15.
\(35 - 15 = 20\)
20 more children

Explanation

Read both bars, then take away to find the difference. You can also count up the scale from 15 to 35 in 5s. A common mistake is to count the 4 gaps and answer 4.

Mark scheme
  1. 1 mark

    reads Walk as 35 and Bike as 15; or the correct answer 20 with no working

    Accept counting 4 steps of 5 between the two bars.

  2. 1 mark

    20 (more children)

    Do not accept 4 (the number of gaps). A correct answer with no working scores full marks.

Question 3

2 marks

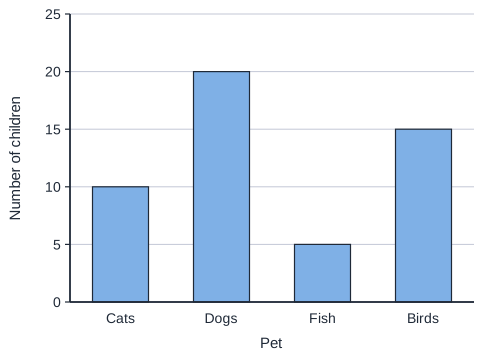
The bar chart shows the pets of children in a class.

Ollie says, "4 children have a dog, because the bar goes up 4 lines."

Is Ollie right? How do you know?

A bar chart of pets: Cats, Dogs, Fish and Birds. The vertical axis, Number of children, goes from 0 to 25 and is numbered every 5, with a grid line at each number. The heights of the bars can be read from the scale.

Model answer

No. The scale goes up in 5s, so each line is worth 5. The Dogs bar reaches 20, so 20 children have a dog.

Explanation

Always read the number on the scale and not the number of lines. Ollie counted the lines, but each one is worth 5. A correct way to check is to count 5, 10, 15, 20 up the scale.

Mark scheme
  1. 1 mark

    No, with a relevant but incomplete reason, such as 'he has not used the scale'

    No alone scores 0.

  2. 1 mark

    a complete reason: the scale goes up in 5s, so the bar shows 20 children

    Accept '20 children have a dog' with a mention of the scale or of counting in 5s. A complete correct reason on its own scores both marks.

Question 4

4 marks

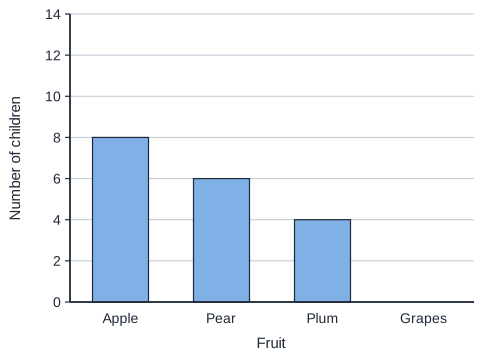
The bar chart shows the fruit that some children chose. The bar for Grapes is missing.

4 more children chose Grapes than Pear.

How many children chose Grapes?

How many children chose a fruit altogether?

A bar chart of fruit chosen: Apple, Pear, Plum and Grapes. There is no bar for Grapes. The vertical axis, Number of children, goes from 0 to 14 and is numbered every 2, with a grid line at each number. The heights of the bars can be read from the scale.

Model answer

Pear: 6.
Grapes: \(6 + 4 = 10\) children.
\(8 + 6 + 4 + 10 = 28\)
28 children altogether.

Explanation

Read the Pear bar first: it shows 6. Grapes is 4 more, so \(6 + 4 = 10\). Then add all four numbers, and remember to put in Grapes. A common mistake is to add only the three bars you can see and get 18.

Mark scheme
  1. 1 mark

    reads Pear as 6; or the correct answers (10 children, 28 children) with no working

    Accept \(6 + 4\).

  2. 1 mark

    10 (children chose Grapes)

    From \(6 + 4\). Allow follow-through from a wrong reading of Pear.

  3. 1 mark

    adds the four numbers, such as \(8 + 6 + 4 + 10\)

    Allow follow-through from the pupil's readings and their number for Grapes.

  4. 1 mark

    28 (children)

    Allow follow-through. Do not accept 18, which leaves out Grapes. A correct answer with no working scores full marks.

Ready to try the rest? Tap your answers and see straight away how you did.

Topic notes

Bar charts

The big idea

A bar chart shows numbers as bars. The taller the bar, the bigger the number. Bar charts help us to compare things quickly, such as which vegetable grew best in a garden.

Parts of a bar chart

  • The title says what the chart is about.
  • The axis is one of the two straight lines at the edge of the chart. Each axis has a label.
  • The scale is the numbers going up the side.

Reading the scale

Before you read a bar, look at the scale. It may go up in 2s, 5s or 10s. So each step on the scale may not be worth 1.

To read a bar, go to the top of the bar. Then look straight across to the scale. A ruler can help. Some charts also have faint lines between the numbers. Do not count those: use the numbered lines.

Sometimes a bar stops exactly halfway between two numbers. Then its number is halfway between them.

The scale goes up inThe bar stops halfway betweenThe bar shows
2s12 and 1413
10s70 and 8075
A bar chart of vegetables picked. Number picked goes up the side in 10s, from 0 to 60. Carrots 30, peas 55, beans 25 and leeks 40.
The scale goes up in 10s. Each number is also printed on its bar.

Look at the vegetable chart. Which vegetable had exactly 55 picked?

The scale goes up in 10s.

55 is not on the scale, but it is halfway between 50 and 60.

Look for the bar that stops halfway between 50 and 60. That bar is Peas.

Most, least and totals

The most popular thing has the tallest bar. The least popular thing has the shortest bar. You can see these without reading any numbers. The question may ask for the name, so check that you do not write a number.

To find a total, read every bar and add. For how many more or how many fewer, read two bars. Then take the smaller number away from the bigger one.

The children give 20 of the leeks to the school kitchen. Now are there more leeks or more beans? How many more?

This has two steps.

Step 1: find how many leeks are left. The Leeks bar stops on 40.

\(40 - 20 = 20\) leeks are left.

Step 2: read the Beans bar. It stops halfway between 20 and 30, so it shows 25.

25 is more than 20, so now there are more beans.

\(25 - 20 = 5\), so there are 5 more beans than leeks.

Checking a chart against a table

A table and a bar chart can show the same numbers. To check a chart, take one row of the table at a time. Find its bar and read the bar. If the bar does not match the table, that bar is wrong. Say a table shows 10 rainy days in April. Then the April bar below must stop on 10.

A bar chart of rainy days. The number of rainy days goes up the side in 2s, from 0 to 14. January 11, February 6, March 5 and April 10.
The scale goes up in 2s. The January and March bars stop halfway between two numbers.

How many more rainy days were there in the two wettest months than in the two driest months?

Read the bars. The scale goes up in 2s.

  • January stops halfway between 10 and 12, so it shows 11.
  • February stops on 6, and April stops on 10.
  • March stops halfway between 4 and 6, so it shows 5.

The two wettest months are January and April: \(11 + 10 = 21\).

The two driest months are February and March: \(6 + 5 = 11\).

Now find the difference: \(21 - 11 = 10\).

There were 10 more rainy days.

Some bar charts lie on their side. The bars go across and the scale is along the bottom. You read them the same way. If you compare two charts, read both scales first. The same height can show different numbers.

Common mistakes

  • Counting the lines and not reading the numbers. A bar that goes up 3 lines on a scale in 10s shows 30, not 3.
  • Choosing the nearest number when a bar stops halfway. Halfway between 4 and 6 is 5, not 4 or 6.
  • Writing a number when the question asks which one is most popular. Write the name.
  • Stopping too soon in a two-step question. Read the question again to see what it asks for.
  • Comparing the heights of bars on two charts without reading their scales.

Top tip

Say the scale out loud before you start, such as "10, 20, 30". Then use a ruler to go straight across from the top of the bar.

Study Helper Hints first, answers after you try

Stuck on this one? Ask for a hint and I’ll point you in the right direction, without giving the answer away. Once you’ve checked your answer, I’ll show you how the marks are awarded.