
Level:
Correct: 0
Incorrect: 0
Marks: 0/0
Exam Practice
Course:
Topics:
Edexcel GCSE Biology (Paper 1) Smart practice A mixed round aimed at your weak spots
Unit 1
Key concepts in biology
Unit 2
Cells and control
Unit 3
Genetics
Unit 4
Natural selection and genetic modification
Unit 5
Health, disease and the development of medicines
Avg
score:
–
Topics
done:
0/38

Virus life cycles and plant defences and diseases

Practise 17 exam-style questions on Virus life cycles and plant defences and diseases for Edexcel GCSE Biology (Paper 1). Write your answer as you would in the exam and get it marked in seconds against the mark scheme, point by point, with the Study Helper on hand if you get stuck.

  • 17 questions
  • 1–6 marks each
  • Instant marking
  • No sign-up needed
17 questions, marked as you go

Sample questions with model answers

Here are 4 of the questions in this topic, each with a model answer, an explanation of why it earns the marks and the mark scheme an examiner would use.

Question 1

1 mark

A farmer finds that the leaves of the wheat plants in one field have turned yellow.

Which observation suggests that the yellowing has an environmental cause and is not caused by a pathogen?

Choose your answer.

  • A yellowing spreads across the field
  • B all plants turned yellow at once
  • C patches of yellow plants get larger
  • D fungal spores on the yellow leaves

Model answer

B - all plants turned yellow at once

Explanation

An environmental cause such as frost, a lack of mineral ions or a weedkiller spray affects all the plants at about the same time. A pathogen usually starts in a few plants and spreads, so the affected area grows over time. Looking at the distribution of affected plants is one way of telling these causes apart.

Mark scheme
  1. 1 mark

    B / all plants turned yellow at once (1)

    The only correct answer is B. A is not correct because yellowing that spreads across the field over time suggests a pathogen passing from plant to plant; C is not correct because patches that get larger suggest a pathogen spreading from infected plants to the plants around them; D is not correct because fungal spores on the leaves suggest a fungal pathogen. Accept the letter or the option. If more than one option is given, do not award the mark.
Question 2

2 marks

Some test kits for plant diseases can be used in the field. A test kit for one plant virus contains monoclonal antibodies.

Explain why this test kit can only detect this one virus.

Model answer

The monoclonal antibodies in the kit are all identical and specific: they have a shape that is complementary to, and binds to, only one antigen. This antigen is only found on this virus, and other viruses have antigens with different shapes, so the antibodies will not bind to them.

Explanation

Monoclonal antibodies come from one clone of cells, so they are all the same and bind to only one antigen. Because each type of pathogen has its own antigens, a test based on them is specific to one pathogen. Saying the antibody 'kills' the virus is wrong - in a test kit it binds to show that the virus is present.

Mark scheme
  1. 1 mark

    the monoclonal antibodies are all identical / specific and bind to only one antigen (1)

    An explanation linking the two points. accept the antibodies have a shape complementary to one antigen.

  2. 1 mark

    this antigen is only found on this virus / other viruses have antigens with different shapes (1)

    accept the antibodies will not bind to (the antigens of) other viruses.

Question 3

3 marks

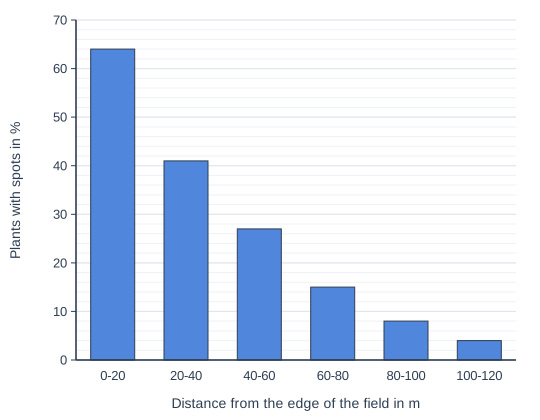
A farmer noticed pale spots on the leaves of some oilseed rape plants in a field. The field is next to a field where the same disease was found last year. The wind usually blows from that field across the oilseed rape field.

The farmer recorded the percentage of plants with spots in strips at different distances from the edge of the field nearest the infected field.

The bar chart shows the results.

Describe the distribution of the affected plants and suggest how the pathogen was spread. Give a reason for your answer.

Bar chart of plants with spots in % for each distance from the edge of the field: 0-20 64, 20-40 41, 40-60 27, 60-80 15, 80-100 8, 100-120 4.

Model answer

The percentage of plants with spots is highest nearest the infected field (64% at 0-20 m) and decreases steadily with distance, to only 4% at 100-120 m. This suggests the pathogen is airborne, with spores carried by the wind from the infected field. The plants closest to the infected field and downwind of it are reached by the most spores, and fewer spores reach plants further away.

Explanation

Distribution analysis means looking at where affected plants are, to work out how the pathogen spreads. A steady fall in infection with distance from a source, in the direction the wind blows, points to airborne spores. A patch spreading from one spot, or affected plants along a wet area, would point to spread in soil or water instead.

Mark scheme
  1. 1 mark

    the percentage of plants with spots decreases with distance from the edge nearest the infected field (1)

    accept the most affected plants are nearest the infected field; accept data, e.g. 64% at 0-20 m falling to 4% at 100-120 m.

  2. 1 mark

    the pathogen was spread by the wind / is airborne / spores carried in the air (1)

    accept spread from the infected field by the wind; do not accept spread in the soil / water / by insects.

  3. 1 mark

    because the plants most affected are closest to (and downwind of) the source of infection, and fewer spores reach plants further away (1)

    accept the gradient matches the direction of the wind from the infected field; this mark needs a reason linked to the pattern, not a repeat of the description.

Question 4

4 marks

The leaves of many plants are covered by a waxy cuticle.

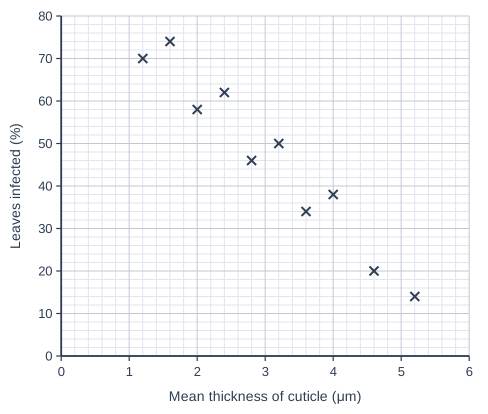
Scientists sprayed spores of a fungus onto the leaves of 10 varieties of a crop plant. For each variety, they measured the mean thickness of the cuticle and the percentage of leaves that became infected.

The graph shows their results.

Describe the relationship shown by the graph and explain why it occurs.

Suggest why 14% of the leaves of the variety with the thickest cuticle still became infected.

Scatter graph on a grid of small squares. The horizontal axis is "Mean thickness of cuticle (μm)", from 0 to 6, numbered every 1, with 5 small squares between numbered values (each small square is 0.2). The vertical axis is "Leaves infected (%)", from 0 to 80, numbered every 10, with 5 small squares between numbered values (each small square is 2). 10 points are plotted as crosses: (1.2, 70), (1.6, 74), (2, 58), (2.4, 62), (2.8, 46), (3.2, 50), (3.6, 34), (4, 38), (4.6, 20) and (5.2, 14).

Model answer

There is a negative correlation: the thicker the cuticle, the lower the percentage of leaves infected. For example, the variety with a 1.2 μm cuticle had 70% of its leaves infected, but the variety with a 5.2 μm cuticle had only 14% infected. The waxy cuticle is a physical barrier, and a thicker cuticle is harder for the fungus to grow through to reach the cells of the leaf.

Some leaves were still infected because the fungus could get in through the stomata or through wounds where the cuticle was damaged.

Explanation

Describe the pattern first (a negative correlation, with data if you can), then explain it using the cuticle as a physical barrier that a thicker layer makes harder to cross. The cuticle does not cover the pores (stomata) or damaged areas, so pathogens can still get in there. Do not confuse the direction of the correlation.

Mark scheme
  1. 1 mark

    negative correlation / the thicker the cuticle, the lower the percentage of leaves infected (1)

    accept as thickness increases, infection decreases; accept a correct comparison using data (e.g. 1.2 μm: 70% but 5.2 μm: 14%); do not accept positive correlation.

  2. 1 mark

    the cuticle is a (physical) barrier to the fungus / to pathogens (1)

    accept the cuticle stops pathogens entering the leaf.

  3. 1 mark

    a thicker cuticle is harder / takes longer for the fungus (hyphae) to get through to reach the cells (1)

    accept fewer fungal spores / hyphae can penetrate a thicker cuticle.

  4. 1 mark

    the fungus can enter through the stomata / through wounds or damaged areas (where there is no cuticle) (1)

    accept through holes made by insects / pests; accept the fungus can still break through some thick cuticles; accept some leaves had a thinner cuticle than the mean for the variety / cuticle thickness varies between leaves; ignore 'the leaves were weak'.

Ready to try the rest? Every answer you write is marked against the mark scheme, so you can see exactly where the marks are.

Study Helper Hints first, answers after you try

Stuck on this one? Ask for a hint and I’ll point you in the right direction, without giving the answer away. Once you’ve checked your answer, I’ll show you how the marks are awarded.