
Level:
Correct: 0
Incorrect: 0
Marks: 0/0
Exam Practice
Course:
Topics:
Edexcel GCSE Biology (Paper 1) Smart practice A mixed round aimed at your weak spots
Unit 1
Key concepts in biology
Unit 2
Cells and control
Unit 3
Genetics
Unit 4
Natural selection and genetic modification
Unit 5
Health, disease and the development of medicines
Avg
score:
–
Topics
done:
0/38

Growth, differentiation and percentile charts

Practise 15 exam-style questions on Growth, differentiation and percentile charts for Edexcel GCSE Biology (Paper 1). Write your answer as you would in the exam and get it marked in seconds against the mark scheme, point by point, with the Study Helper on hand if you get stuck.

  • 15 questions
  • 1–6 marks each
  • Instant marking
  • No sign-up needed
15 questions, marked as you go

Sample questions with model answers

Here are 4 of the questions in this topic, each with a model answer, an explanation of why it earns the marks and the mark scheme an examiner would use.

Question 1

1 mark

What happens to a cell during cell differentiation?

Choose your answer.

  • A a cell divides into two cells
  • B a cell gets longer
  • C a cell becomes specialised
  • D a cell divides uncontrollably

Model answer

C - a cell becomes specialised.

Explanation

Differentiation is the process by which a cell becomes specialised, developing the structures it needs to carry out a particular function. Cell division increases the number of cells and elongation increases their length, but neither makes a cell specialised.

Mark scheme
  1. 1 mark

    C / a cell becomes specialised (1)

    The only correct answer is C. A is not correct because this describes cell division (mitosis); B is not correct because this describes cell elongation in plants; D is not correct because this describes what happens in cancer. Accept the letter or the option. If more than one option is given, do not award the mark.
Question 2

2 marks

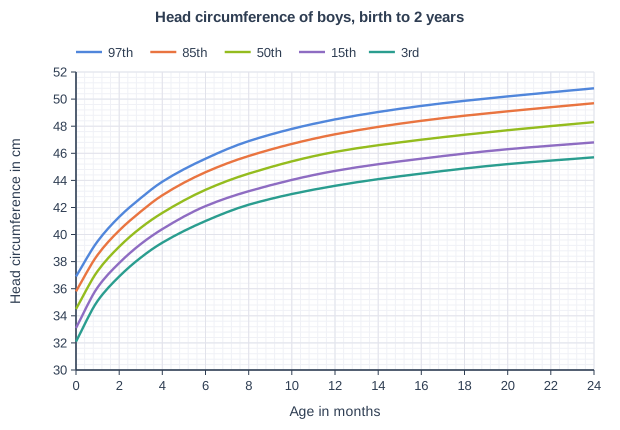
Health visitors measure the head circumference of babies to monitor their growth.

The graph shows a percentile chart for the head circumference of boys from birth to 24 months. It is based on the World Health Organization (WHO) Child Growth Standards.

Use the graph to estimate:

the head circumference of a 10-month-old boy on the 50th percentile

the percentile of a 22-month-old boy whose head circumference is 46.6 cm.

Head circumference of boys, birth to 2 years. Line graph of head circumference in cm (y-axis, 30 to 52) against age in months (x-axis, 0 to 24). "97th" is a smooth curve through (0, 36.9), (1, 39.5), (2, 41.3), (3, 42.7), (4, 43.9), (6, 45.6), (8, 46.9), (12, 48.5), (16, 49.5), (20, 50.2), (24, 50.8). "85th" is a smooth curve through (0, 35.8), (1, 38.5), (2, 40.3), (3, 41.7), (4, 42.9), (6, 44.6), (8, 45.8), (12, 47.4), (16, 48.4), (20, 49.1), (24, 49.7). "50th" is a smooth curve through (0, 34.5), (1, 37.3), (2, 39.1), (3, 40.5), (4, 41.6), (6, 43.3), (8, 44.5), (12, 46.1), (16, 47), (20, 47.7), (24, 48.3). "15th" is a smooth curve through (0, 33.1), (1, 36.1), (2, 37.9), (3, 39.3), (4, 40.4), (6, 42.1), (8, 43.2), (12, 44.7), (16, 45.6), (20, 46.3), (24, 46.8). "3rd" is a smooth curve through (0, 32.1), (1, 35.1), (2, 36.9), (3, 38.3), (4, 39.4), (6, 41), (8, 42.2), (12, 43.6), (16, 44.5), (20, 45.2), (24, 45.7).

Model answer

The head circumference of a 10-month-old boy on the 50th percentile is about 45.4 cm.
A 22-month-old boy with a head circumference of 46.6 cm is on the 15th percentile.

Explanation

Go up from the age on the x-axis to the correct curve, then across to the y-axis, using the small squares to read the value accurately. For the second reading, find where 22 months and 46.6 cm meet: this point lies on the 15th percentile curve.

Mark scheme
  1. 1 mark

    45.4 (cm) (1)

    accept any value from 45.2 to 45.6; an answer in the range 45.2 to 45.6 cm with no working scores marking point 1

  2. 1 mark

    15th (percentile) (1)

    accept 15; do not accept a range such as 'between the 3rd and 50th'

Question 3

3 marks

During the development of a fetus, its muscles form from cells called myoblasts. Myoblasts are unspecialised cells that can divide by mitosis. When myoblasts differentiate, they become muscle cells containing long protein fibres that can contract (shorten). Muscle cells cannot divide.

Explain why both the division and the differentiation of myoblasts are important in the development of the fetus's muscles.

Model answer

The myoblasts divide by mitosis to produce a large number of cells, so the muscles can grow. This has to happen before the myoblasts differentiate, because muscle cells cannot divide, so all the muscle cells must come from dividing myoblasts. Differentiation then makes the cells specialised: they develop long protein fibres that can contract, so the muscles can contract and move parts of the body.

Explanation

Growth in animals involves cell division, which increases the number of cells, and differentiation, which makes those cells specialised for a particular function. Because specialised muscle cells cannot divide, the unspecialised myoblasts must divide first and then differentiate. Answers that only describe the protein fibres, without explaining why both processes are needed, cannot score full marks.

Mark scheme
  1. 1 mark

    myoblasts divide (by mitosis) to produce more cells / a large number of cells (1)

    An explanation linking three from the four points; max 3. accept the number of cells increases so the muscle can grow; do not accept meiosis

  2. 1 mark

    differentiation makes the cells specialised / produces specialised muscle cells (1)

    accept the cells develop the structures they need for their function; ignore 'the cells change' with no idea of becoming specialised

  3. 1 mark

    the protein fibres allow the muscle cells to contract, so the muscles can move parts of the body (1)

    accept so the muscle cells can carry out their function (contraction); a description of the fibres alone, with no link to the function, does not score

  4. 1 mark

    muscle cells cannot divide, so all the cells must be produced by myoblasts dividing before they differentiate (1)

    accept if the myoblasts differentiated straight away there would not be enough muscle cells / the muscles could not grow

Question 4

4 marks

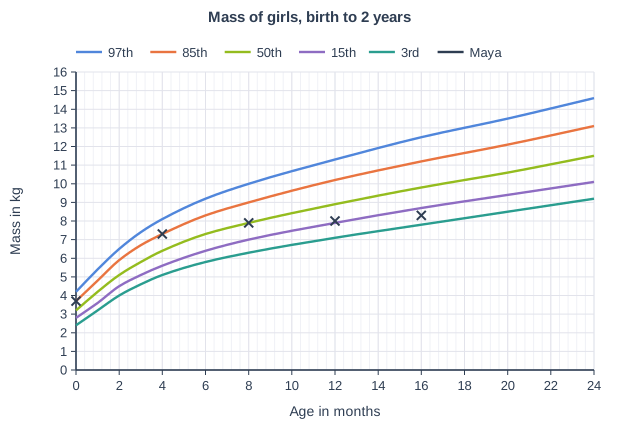
The graph shows a percentile chart for the mass of girls from birth to 24 months, based on the World Health Organization (WHO) Child Growth Standards. Maya's mass at five checks is also plotted.

Maya's doctor is concerned about her growth.

Explain why the doctor is concerned. Use data from the graph in your answer.

Mass of girls, birth to 2 years. Line graph of mass in kg (y-axis, 0 to 16) against age in months (x-axis, 0 to 24). "97th" is a smooth curve through (0, 4.2), (1, 5.4), (2, 6.5), (3, 7.4), (4, 8.1), (6, 9.2), (8, 10), (12, 11.3), (16, 12.5), (20, 13.5), (24, 14.6). "85th" is a smooth curve through (0, 3.7), (1, 4.8), (2, 5.9), (3, 6.7), (4, 7.3), (6, 8.3), (8, 9), (12, 10.2), (16, 11.2), (20, 12.1), (24, 13.1). "50th" is a smooth curve through (0, 3.2), (1, 4.2), (2, 5.1), (3, 5.8), (4, 6.4), (6, 7.3), (8, 7.9), (12, 8.9), (16, 9.8), (20, 10.6), (24, 11.5). "15th" is a smooth curve through (0, 2.8), (1, 3.6), (2, 4.5), (3, 5.1), (4, 5.6), (6, 6.4), (8, 7), (12, 7.9), (16, 8.7), (20, 9.4), (24, 10.1). "3rd" is a smooth curve through (0, 2.4), (1, 3.2), (2, 4), (3, 4.6), (4, 5.1), (6, 5.8), (8, 6.3), (12, 7.1), (16, 7.8), (20, 8.5), (24, 9.2). "Maya" is shown as plotted points only (no line), at (0, 3.7), (4, 7.3), (8, 7.9), (12, 8), (16, 8.3).

Model answer

At birth and at 4 months Maya's mass was on the 85th percentile. After that she crossed the percentile lines: she was on the 50th percentile at 8 months and below the 15th percentile at 16 months. Her mass only increased by 0.4 kg between 8 and 16 months, from 7.9 kg to 8.3 kg, whereas a girl on the 50th percentile gains 1.9 kg in that time. A healthy child's mass usually follows the same percentile, so this suggests Maya is not gaining enough mass, perhaps because she is not getting enough food or has an illness.

Explanation

Percentile charts are used to spot changes: a child normally tracks along one percentile, so a drop across two or more percentile lines is a warning sign even though the mass is still increasing. Use readings from the graph, such as the percentiles at two ages or the gain in mass, to support the explanation.

Mark scheme
  1. 1 mark

    Maya's mass was on the 85th percentile at birth and at 4 months (1)

    An explanation linking four from the five points; max 4.

  2. 1 mark

    her mass then fell to the 50th percentile at 8 months and below the 15th percentile by 16 months / she crossed two or more percentile lines (1)

    accept she dropped from the 85th percentile to between the 3rd and 15th percentiles; ignore 'she is losing mass' (her mass increased)

  3. 1 mark

    her mass increased very slowly, e.g. only 0.4 kg from 8 to 16 months compared with 1.9 kg on the 50th percentile (1)

    accept other correct use of data showing slow gain, e.g. 7.9 kg at 8 months and 8.3 kg at 16 months

  4. 1 mark

    a healthy child's mass usually stays on / follows (close to) the same percentile (1)

    accept she should have stayed near the 85th percentile

  5. 1 mark

    so she may not be gaining enough mass because of a problem, e.g. not enough food / an illness (1)

    accept she may be malnourished / have a health problem that needs investigating

Ready to try the rest? Every answer you write is marked against the mark scheme, so you can see exactly where the marks are.

Study Helper Hints first, answers after you try

Stuck on this one? Ask for a hint and I’ll point you in the right direction, without giving the answer away. Once you’ve checked your answer, I’ll show you how the marks are awarded.