Tropical cyclones: formation, distribution and structure
Practise 27 exam-style questions on Tropical cyclones: formation, distribution and structure for Edexcel GCSE Geography B (Paper 1). Write your answer as you would in the exam and get it marked in seconds against the mark scheme, point by point, with the Study Helper on hand if you get stuck.
27 questions
1–8 marks each
Instant marking
No sign-up needed
20 questions, marked as you go
Sample questions with model answers
Here are 4 of the questions in this topic, each with a model answer, an explanation of why it earns the marks and the mark scheme an examiner would use.
Question 1
1 mark
Tropical cyclones develop only where the upper layer of the ocean, to a depth of about 50 m, is warm enough.
State the lowest temperature that this water usually needs to reach.
Model answer
About 26.5 °C
Explanation
Tropical cyclones need the upper ocean to be at least about 26.5 °C, usually to a depth of about 50 m, so that enough water evaporates to supply heat energy. Warm water alone is not enough: the storm also needs to be at least about 5° from the Equator and to have low wind shear.
Mark scheme
1 mark
26.5 °C (accept any value from 26 °C to 27 °C, e.g. 'above 26 °C' or '27 °C')
Units are not required if the value is clearly a temperature in °C. Accept about 80 °F. Do not accept values outside 26-27 °C (e.g. 20 °C or 30 °C) or vague answers such as 'warm water'.
Question 2
2 marks
In the northern hemisphere the winds in a tropical cyclone turn anticlockwise around the eye. In the southern hemisphere they turn clockwise.
Explain one reason why the winds in a southern hemisphere tropical cyclone turn clockwise.
Model answer
The Coriolis effect, caused by the Earth's rotation, deflects moving air. In the southern hemisphere air is deflected to the left as it flows in towards the low-pressure centre, so it spirals clockwise around the eye.
Explanation
The first mark is for the Coriolis effect (the Earth's rotation). The second explains the direction: deflection to the left in the southern hemisphere turns inflowing air clockwise. Simply repeating that the storm is in the southern hemisphere does not explain why.
Mark scheme
1 mark
Identifies the Coriolis effect / the rotation of the Earth deflects moving air
Examples: The Coriolis effect caused by the Earth's rotation deflects moving air (1) to the left in the southern hemisphere, so air flowing in towards the low-pressure centre is turned into a clockwise spiral (1). The Earth spins (1) which turns winds to the left south of the Equator, so the inflowing air circles clockwise around the eye (1). Accept any other appropriate response.
1 mark
Explains how this gives clockwise winds, e.g. air is deflected to the left in the southern hemisphere as it flows in towards the low pressure, so it spirals clockwise
Do not credit 'because it is in the southern hemisphere' on its own (this is given in the question). Credit a correct comparison, e.g. air is deflected to the right in the northern hemisphere so cyclones there turn anticlockwise, only if it is linked to the clockwise turning here.
Question 3
2 marks
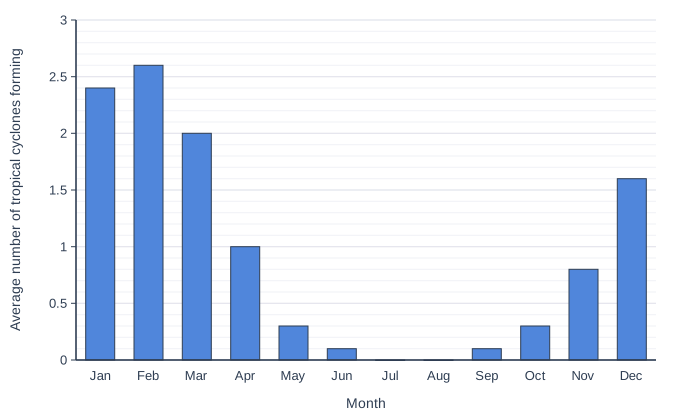
Figure 1 shows the average number of tropical cyclones that form in each month in an ocean basin in the southern hemisphere. The data are hypothetical (written for this course).
Describe another data presentation technique that could be used to show the data in Figure 1.
Model answer
A line graph could be used. The months would go along the x-axis and the average number of tropical cyclones forming on the y-axis, with each month's value plotted and the points joined by straight lines.
Explanation
One mark is for a suitable technique and one for describing how it would be drawn, such as what goes on each axis. Naming a technique without describing it earns only 1 mark, and a bar chart cannot be credited because Figure 1 already is one.
Mark scheme
1 mark
Names a suitable technique other than a bar chart, e.g. a line graph / a pie chart / a radial (circular) graph / a pictogram
Do not credit a bar chart, column graph or histogram (already used), or techniques that do not suit one value for each month (e.g. a scatter graph, a choropleth map). Examples: A line graph (1) with the months along the x-axis and the average number of cyclones on the y-axis, with the points joined by straight lines (1). A pie chart (1) with one sector for each month, its angle proportional to that month's share of the year's cyclones (e.g. February 2.6 of 11.2, about 84 degrees) (1). A radial graph (1) with the twelve months spaced around a circle and the number of cyclones measured out from the centre (1). Accept any other appropriate response.
1 mark
Describes how the technique would be drawn, e.g. its axes or how sectors/symbols are sized
The description must fit the technique named (e.g. both axes for a line graph, or sectors proportional to the values for a pie chart).
Question 4
4 marks
A study published in the journal Nature in 2014 looked at tropical cyclones over the previous 30 years. It found that the average latitude at which tropical cyclones reached their greatest strength had moved away from the Equator, by about 53 km per decade in the northern hemisphere and about 62 km per decade in the southern hemisphere.
Suggest two reasons for this change.
Model answer
First, global warming has warmed the oceans, so sea water above about 26.5 °C now stretches further from the Equator. Cyclones can therefore keep gaining energy from evaporation and condensation for longer as they move polewards, so they reach their greatest strength further from the Equator.
Second, the global atmospheric circulation may be changing as the climate warms, with the tropics widening. This moves the sub-tropical high-pressure belts and the winds that steer cyclones further polewards, so cyclones are carried further from the Equator before they reach their peak.
Explanation
Each reason earns 1 mark and its development a second. Good answers link the change to warmer seas or to changes in the global circulation and winds, using knowledge from earlier in the course. The question is about where cyclones reach their greatest strength, so simply saying that cyclones are getting stronger does not explain the change.
Mark scheme
1 mark
Suggests a first reason, e.g. the oceans have warmed, so a larger area of sea further from the Equator is warm enough (above about 26.5 °C) to keep supplying energy to cyclones
Examples: Global warming has warmed the oceans (1), so water above about 26.5 °C now stretches further from the Equator and cyclones can keep gaining energy from evaporation and condensation for longer as they move polewards (1). The tropics may be widening as the global atmospheric circulation changes, moving the sub-tropical high-pressure belts and the winds that steer cyclones further from the Equator (1), so cyclones are carried further polewards before they reach their peak (1). Wind shear may have become weaker further from the Equator, or stronger close to it (1), so cyclones can keep strengthening at higher latitudes (1). Cyclone tracks may have changed, e.g. more cyclones curving polewards (1), so they reach their greatest strength further from the Equator (1). Accept any other appropriate response.
1 mark
Develops the first reason, e.g. so cyclones keep gaining energy further from the Equator before they reach their peak
The development must explain how the reason moves the place where cyclones are strongest away from the Equator.
1 mark
Suggests a second, different reason, e.g. the tropics are widening as the global circulation changes / changes in wind shear / changes in the winds that steer cyclones and in their tracks
The two reasons must be different. Do not credit the same idea twice in different words, e.g. 'warmer seas' and 'higher sea temperatures'. Do not credit 'cyclones are getting stronger' unless it is linked to where they reach their peak.
1 mark
Develops the second reason
The development must explain how the second reason moves the place where cyclones are strongest away from the Equator. Accept any other appropriate response.
Ready to try the rest? Every answer you write is marked against the mark scheme, so you can see exactly where the marks are.
Ctrl + Enter to check
Study HelperHints first, answers after you try
Stuck on this one? Ask for a hint and I’ll point you in the right direction, without giving the answer away. Once you’ve checked your answer, I’ll show you how the marks are awarded.