Level:
Correct: 0
Incorrect: 0
Marks: 0/0
Exam Practice
Course:
Topics:
Edexcel GCSE Geography B (Paper 1) Smart practice A mixed round aimed at your weak spots
Avg
score:
–
Topics
done:
0/23

How cities change over time and urban land use

Practise 26 exam-style questions on How cities change over time and urban land use for Edexcel GCSE Geography B (Paper 1). Write your answer as you would in the exam and get it marked in seconds against the mark scheme, point by point, with the Study Helper on hand if you get stuck.

  • 26 questions
  • 1–8 marks each
  • Instant marking
  • No sign-up needed
20 questions, marked as you go

Sample questions with model answers

Here are 4 of the questions in this topic, each with a model answer, an explanation of why it earns the marks and the mark scheme an examiner would use.

Question 1

1 mark

Study Figure 1, which describes what a satellite image shows in three areas of a city in a developed country. The descriptions were written for this course.

Identify the main land use in Area Z.
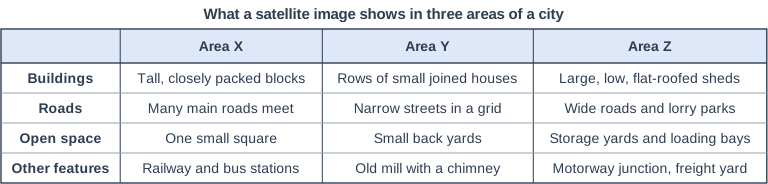
What a satellite image shows in three areas of a city. Table with columns (row headings), "Area X", "Area Y", "Area Z". Buildings; Area X: Tall, closely packed blocks; Area Y: Rows of small joined houses; Area Z: Large, low, flat-roofed sheds | Roads; Area X: Many main roads meet; Area Y: Narrow streets in a grid; Area Z: Wide roads and lorry parks | Open space; Area X: One small square; Area Y: Small back yards; Area Z: Storage yards and loading bays | Other features; Area X: Railway and bus stations; Area Y: Old mill with a chimney; Area Z: Motorway junction, freight yard.

Model answer

Industrial land use (a modern industrial estate with warehouses).

Explanation

On a satellite image, industrial areas have large, low buildings with flat roofs, lorry parks, loading bays and storage yards, often beside a motorway junction or railway. Large buildings alone are not enough: look for the evidence that goods are being made, stored or moved.

Mark scheme
  1. 1 mark

    Industrial (e.g. a modern industrial estate / warehouses / distribution centres)

    Accept industry, industrial estate, factories, warehousing or distribution. Do not accept residential, commercial or retail: the lorry parks, loading bays, storage yards and freight yard show the area is used for making, storing or moving goods. All other answers are incorrect.
Question 2

2 marks

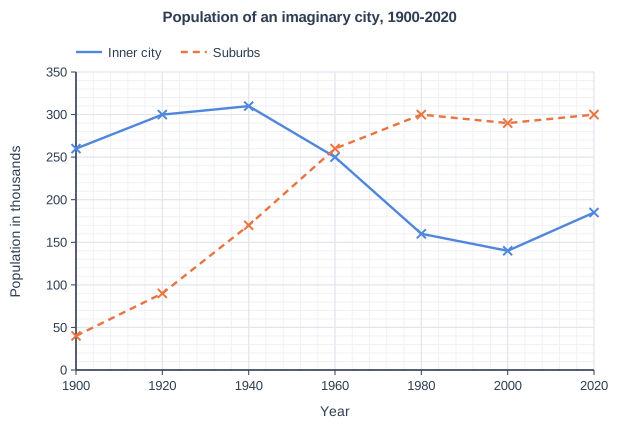
Study Figure 1, which shows the population of the inner city and the suburbs of an imaginary city in a developed country between 1900 and 2020. The data were written for this course.

In 1940 the population of the inner city was 310 thousand. In 1980 it was 160 thousand.

Calculate the percentage change in the population of the inner city between 1940 and 1980.

Answer to one decimal place.

Show your working.

Population of an imaginary city, 1900-2020. Line graph of population in thousands (y-axis, 0 to 350) against year (x-axis, 1900 to 2020). "Inner city" joins the points (1900, 260), (1920, 300), (1940, 310), (1960, 250), (1980, 160), (2000, 140), (2020, 185). "Suburbs" (dashed) joins the points (1900, 40), (1920, 90), (1940, 170), (1960, 260), (1980, 300), (2000, 290), (2020, 300).

Model answer

Change = 160 - 310 = -150 thousand
Percentage change = -150 ÷ 310 × 100 = -48.4%
The inner city's population fell by 48.4%.

Explanation

Percentage change = (new value - original value) ÷ original value × 100, using the 1940 value as the original. The answer is negative because the population fell, so make it clear that it is a decrease.

Mark scheme
  1. 1 mark

    Correct method, e.g. (160 - 310) ÷ 310 × 100 / 150 ÷ 310 × 100 (correct answer -48.4%, a decrease of 48.4%)

    Correct answer: -48.4% (a decrease of 48.4%). Correct answer with no working scores full marks (2). Award this method mark for a correct method using 310 and 160, including working with an arithmetic slip or an answer not given to one decimal place (e.g. -48%).

  2. 1 mark

    -48.4 (%) / a decrease of 48.4%

    Accept -48.4, -48.4%, 48.4% decrease or 'fell by 48.4%'. Must be given to one decimal place: do not credit -48 or -48.39 for this mark. Do not accept 48.4% described as an increase, 93.8 (dividing by the 1980 value) or 51.6 (160 ÷ 310 × 100, the percentage remaining).

Question 3

2 marks

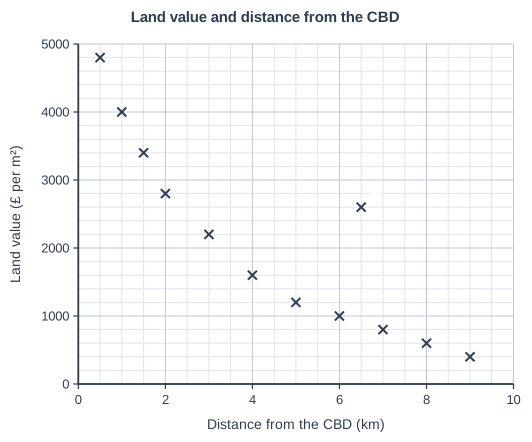
Study Figure 1, which shows land values at sites at different distances from the CBD of an imaginary city. The data were written for this course.

Suggest one reason why the land value at site A is much higher than at other sites a similar distance from the CBD.

Land value and distance from the CBD. Scatter graph on a grid of small squares. The horizontal axis is "Distance from the CBD (km)", from 0 to 10, numbered every 2, with 4 small squares between numbered values (each small square is 0.5). The vertical axis is "Land value (£ per m²)", from 0 to 5000, numbered every 1000, with 5 small squares between numbered values (each small square is 200). 12 points are plotted as crosses: (0.5, 4800), (1, 4000), (1.5, 3400), (2, 2800), (3, 2200), (4, 1600), (5, 1200), (6, 1000), (7, 800), (8, 600) and (9, 400), plus (6.5, 2600) labelled A.

Model answer

Site A may be at a junction of the ring road and a main road. This makes it very accessible, so firms such as retail parks and offices compete for the land, which pushes up its value.

Explanation

Suggest questions ask for a sensible idea that fits the data: site A is 6.5 km out but has a land value of £2600 per m², far above nearby sites. Accessibility is the usual explanation, because land that is easy to reach is in high demand. One mark is for the idea and one for linking it to the land value.

Mark scheme
  1. 1 mark

    Suggests a valid reason, e.g. site A is next to a junction of a ring road, main road or motorway / near a railway station or tram stop / in or next to a suburban shopping centre or retail park / in an attractive, high-status area (e.g. next to a park or river) / land available for development is scarce there

    Examples: Site A may be at the junction of a ring road and a main road (1) so it is very accessible and in demand for retail parks or business parks, which raises its value (1). Site A may be next to a railway station (1) so commuters and businesses want to locate there, increasing demand for the land (1). Site A may be in a suburban shopping centre (1) where many customers gather, so shops are willing to pay high prices for land (1). Accept any other appropriate response.

  2. 1 mark

    Develops the reason, explaining how it raises demand for or the value of the land

    The development must explain the reason given in the first point. Do not credit 'it is an anomaly' or 'it is expensive' as a reason.

Question 4

4 marks

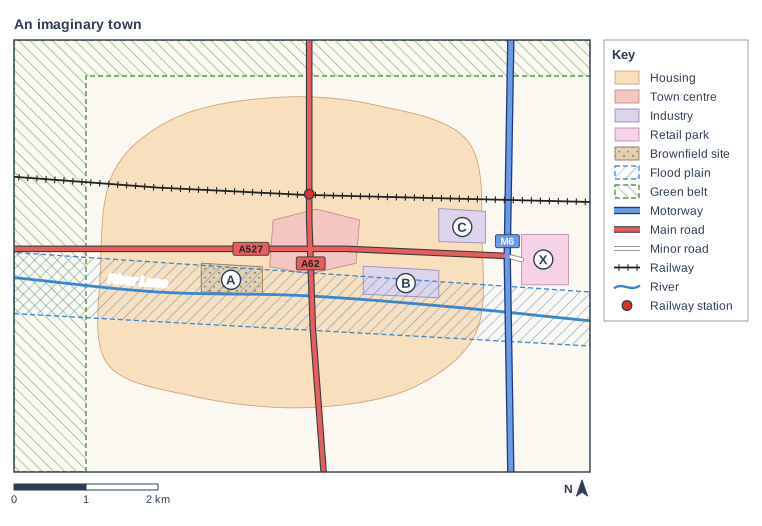
Study Figure 1, which is a map of an imaginary town. The map was written for this course. Planning regulations protect the green belt to the west and north of the town from new building.

Using Figure 1, explain one advantage and one disadvantage of the green belt for the town.

An imaginary town. Map of a local area, 8 km from west to east and 6 km from south to north, with north at the top. Areas: the housing area shown pale orange, in the centre of the map; the town centre shown pink, in the centre of the map; area B (industrial area) shown pale purple, in the east of the map; area C (industrial area) shown pale purple, in the east of the map; area X (retail park) shown pale pink, in the east of the map; area A (brownfield site) shown light brown with small triangles, in the centre of the map; the flood plain shown blue diagonal hatching with a dashed blue outline, in the centre of the map; the green belt shown green diagonal hatching with a dashed green outline, in the north-west of the map. Lines: the River Lune (a river, blue, named) runs from the west edge to the east edge, passing through the centre of the map; the M6 (motorway) runs from the south edge to the north edge, passing through the east of the map; the A527 (main road) runs from the west edge to the east of the map, passing through the centre of the map; the A62 (main road) runs from the north edge to the south edge, passing through the centre of the map; a minor road runs from the east of the map to the east of the map; a railway runs from the west edge to the east edge, passing through the centre of the map. Symbols: the railway station in the centre of the map (inside the housing area; on the A62 (main road); on the railway). Letters in circles: A is in an area shown light brown with small triangles in the centre of the map; B is in an area shown pale purple in the east of the map; C is in an area shown pale purple in the east of the map; X is in an area shown pale pink in the east of the map. The key (beside the map) shows: housing, town centre, industry, retail park, brownfield site, flood plain, green belt, motorway, main road, minor road, railway, river, railway station. Below the map: a scale bar marked 0, 1 and 2 km and a north arrow pointing to the top.

Model answer

One advantage is that the green belt stops the town spreading into the countryside to the west and north. The farmland and open space next to the housing are protected, so residents still have countryside close by for walking and recreation, and wildlife habitats are kept.

One disadvantage is that the green belt limits the land available for new homes. New building is pushed onto less suitable sites inside the town, such as site A, a brownfield site that is mostly on the flood plain of the River Lune, so new buildings there would be at risk of flooding and would need costly flood defences.

Explanation

Each half of the question earns 1 mark for the advantage or disadvantage and 1 mark for developing it. The map shows the green belt along two edges of the town, so strong answers link the points to the town's limited space and to sites such as A. Two advantages, or two disadvantages, can earn only 2 marks. Without any evidence from Figure 1 the answer is limited to 3 marks.

Mark scheme
  1. 1 mark

    Identifies an advantage, e.g. it stops the town spreading (urban sprawl) into the countryside to the west and north / it protects farmland and open countryside close to residents / it encourages new building on brownfield land inside the town, such as site A / it stops the town merging with nearby settlements

    Max 3 if no evidence from Figure 1 is used.

    Evidence from Figure 1 is needed in only one half of the answer, e.g. the green belt lies along the western and northern edges of the town, beyond the housing; brownfield site A lies inside the town next to the town centre, and 91% of it is on the flood plain of the River Lune; the land south of the town and east of the M6 is not green belt. Examples (advantages): The green belt stops the town spreading into the countryside to the west and north (1), so farmland and open space close to the housing are protected for farming, wildlife and recreation (1). Because the town cannot spread into the green belt (1), developers are encouraged to reuse brownfield land inside the town, such as site A next to the town centre, which regenerates derelict land (1). Accept any other appropriate response.

  2. 1 mark

    Develops the advantage

    The development must explain how the advantage benefits the town or its people.

  3. 1 mark

    Identifies a disadvantage, e.g. it limits the land available for new homes and businesses / land and house prices rise / new building is pushed onto less suitable land, such as the flood plain / development jumps beyond the green belt, so people commute further

    Examples (disadvantages): Little land is left for new homes in the west and north of the town (1), so land and house prices rise and young people may not be able to afford homes there (1). New building is pushed onto less suitable sites inside the town, such as brownfield site A, most of which is on the flood plain of the River Lune (1), so new buildings would be at risk of flooding and need costly defences (1). New housing may be built beyond the green belt (1), so more people commute into the town by car, adding to congestion and pollution (1). Do not credit a disadvantage that is simply the opposite of the advantage (e.g. 'the countryside cannot be built on') unless it is developed with a different consequence. Accept any other appropriate response.

  4. 1 mark

    Develops the disadvantage

    The development must explain how the disadvantage affects the town or its people.

Ready to try the rest? Every answer you write is marked against the mark scheme, so you can see exactly where the marks are.

Study Helper Hints first, answers after you try

Stuck on this one? Ask for a hint and I’ll point you in the right direction, without giving the answer away. Once you’ve checked your answer, I’ll show you how the marks are awarded.