
Level:
Correct: 0
Incorrect: 0
Marks: 0/0
Exam Practice
Course:
Topics:
Edexcel GCSE Geography B (Paper 1) Smart practice A mixed round aimed at your weak spots
Avg
score:
–
Topics
done:
0/23

An emerging country: location and context

Practise 25 exam-style questions on An emerging country: location and context for Edexcel GCSE Geography B (Paper 1). Write your answer as you would in the exam and get it marked in seconds against the mark scheme, point by point, with the Study Helper on hand if you get stuck.

  • 25 questions
  • 1–12 marks each
  • Instant marking
  • No sign-up needed
20 questions, marked as you go

Sample questions with model answers

Here are 4 of the questions in this topic, each with a model answer, an explanation of why it earns the marks and the mark scheme an examiner would use.

Question 1

1 mark

Study Figure 1, which shows the percentage of people using the internet in three emerging countries between 2000 and 2024 (source: World Bank).

Identify which one of the following statements is supported by Figure 1.

Choose your answer.

  • A In 2024 more than half of India's population used the internet
  • B India's internet use was higher than Nigeria's in every year shown
  • C Nigeria's internet use more than doubled between 2015 and 2024
  • D Internet use increased by the same amount in China and India between 2000 and 2024
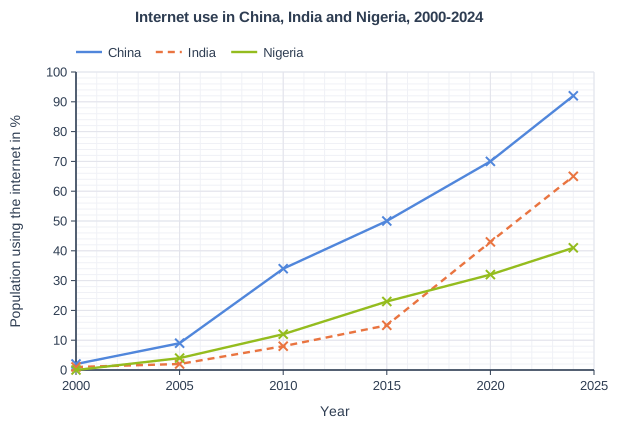
Internet use in China, India and Nigeria, 2000-2024. Line graph of population using the internet in % (y-axis, 0 to 100) against year (x-axis, 2000 to 2025). "China" joins the points (2000, 2), (2005, 9), (2010, 34), (2015, 50), (2020, 70), (2024, 92). "India" (dashed) joins the points (2000, 1), (2005, 2), (2010, 8), (2015, 15), (2020, 43), (2024, 65). "Nigeria" joins the points (2000, 0), (2005, 4), (2010, 12), (2015, 23), (2020, 32), (2024, 41).

Model answer

A

Explanation

India's line reaches about 65% in 2024, which is more than half of the population. Check every statement against the graph: Nigeria was ahead of India until India overtook it between 2015 and 2020, and Nigeria's rise from 23% to 41% is less than double. Reading the lines carefully, year by year, is the key skill here.

Mark scheme
  1. 1 mark

    A (In 2024 more than half of India's population used the internet)

    Accept the letter or the option written out; do not credit more than one answer. India's internet use was 65% in 2024. B is incorrect: Nigeria's internet use was higher than India's in 2005, 2010 and 2015 (e.g. 23% against 15% in 2015). C is incorrect: Nigeria rose from 23% to 41%, which is less than double. D is incorrect: China rose by 90 percentage points (2% to 92%) and India by 64 (1% to 65%). All other answers are incorrect.
Question 2

2 marks

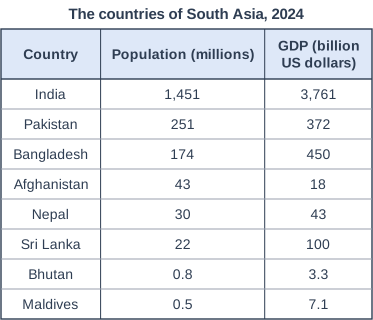
Study Figure 1, which shows the population and Gross Domestic Product (GDP) of the eight countries of South Asia in 2024 (source: World Bank).

Calculate the percentage of South Asia's population that lived in India in 2024.

Show your working.

Answer to one decimal place.

The countries of South Asia, 2024. Table with columns "Country", "Population (millions)", "GDP (billion US dollars)". Country: India; Population (millions): 1,451; GDP (billion US dollars): 3,761 | Country: Pakistan; Population (millions): 251; GDP (billion US dollars): 372 | Country: Bangladesh; Population (millions): 174; GDP (billion US dollars): 450 | Country: Afghanistan; Population (millions): 43; GDP (billion US dollars): 18 | Country: Nepal; Population (millions): 30; GDP (billion US dollars): 43 | Country: Sri Lanka; Population (millions): 22; GDP (billion US dollars): 100 | Country: Bhutan; Population (millions): 0.8; GDP (billion US dollars): 3.3 | Country: Maldives; Population (millions): 0.5; GDP (billion US dollars): 7.1.

Model answer

Total = 1,451 + 251 + 174 + 43 + 30 + 22 + 0.8 + 0.5 = 1,972.3 million
1,451 / 1,972.3 × 100 = 73.6%

Explanation

First add the populations of all eight countries (including India) to get the total for South Asia, then divide India's population by that total and multiply by 100. A common error is to divide India's population by the other seven countries only, which gives a figure that is too large. Give the answer to one decimal place as the question asks.

Mark scheme
  1. 1 mark

    Method: total population of South Asia = 1,451 + 251 + 174 + 43 + 30 + 22 + 0.8 + 0.5 = 1,972.3 million, then (1,451 / 1,972.3) × 100 (1)

    Correct answer: 73.6%. Correct answer with no working scores full marks (2). Award this method mark for correct working (adding all eight populations and dividing India's population by the total, × 100) even if the final answer is wrong or not given to one decimal place. Accept the total rounded to 1,972.

  2. 1 mark

    Answer: 73.6 (%)

    Must be given to one decimal place: do not credit 74 or 73.57 for this mark. Accept 73.6 or 73.6%. Do not accept 278.3 (India's population divided by the total of the other seven countries only).

Question 3

3 marks

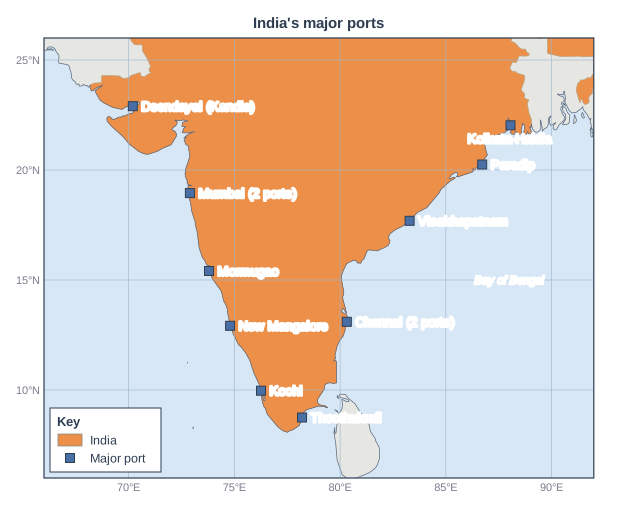
Study Figure 1, which shows the location of the 12 major ports controlled by India's national government. Mumbai and Chennai each have two of these ports.

Describe the distribution of India's major ports shown in Figure 1.

Map of the area from 66°E to 92°E and from 6°N to 26°N, titled "India's major ports". Lines of latitude and longitude are drawn every 5°, with their values (°N/°S and °E/°W) printed round the edge. Countries are shaded in 1 class (key heading "Key"): "India" (shaded): 1 country (1 in Asia). Other countries are grey (not shaded). Sea names printed: Bay of Bengal. Points: a blue square labelled "Deendayal (Kandla)" on the coast of India; a blue square labelled "Mumbai (2 ports)" on the coast of India; a blue square labelled "Mormugao" on the coast of India; a blue square labelled "New Mangalore" on the coast of India; a blue square labelled "Kochi" on the coast of India; a blue square labelled "Thoothukudi" on the coast of India; a blue square labelled "Chennai (2 ports)" on the coast of India; a blue square labelled "Visakhapatnam" on the coast of India; a blue square labelled "Paradip" on the coast of India; a blue square labelled "Kolkata-Haldia" in India. The key (in a box on the map) shows: "India" and "Major port".

Model answer

All of India's major ports are on the coast, with none inland. They are shared evenly between the two coasts, with six on the west coast facing the Arabian Sea and six on the east coast. They are spread along almost the whole coastline, from Deendayal (Kandla) in the north-west to Kolkata-Haldia in the north-east, between about 9 and 23 degrees north, and there are clusters of two ports at Mumbai and at Chennai.

Explanation

Describing a distribution means picking out the overall pattern (coastal or inland, which coasts, spread out or clustered) and supporting it with evidence from the map, such as named ports, directions or latitudes. Each separate, accurate point earns a mark. Do not explain why the ports are where they are - the command word is Describe.

Mark scheme
  1. 3 marks

    One mark for each valid descriptive point, up to 3 marks, e.g. all the ports are on the coast, none inland (1); there are ports on both the west coast (Arabian Sea) and the east coast (mostly the Bay of Bengal) (1); they are shared evenly between the two coasts, six on each (1); they are spread along almost the whole coastline, from Deendayal (Kandla) in the north-west to Kolkata-Haldia in the north-east (1); they lie between about 9 and 23 degrees north (1); there are clusters at Mumbai and Chennai, which each have two ports (1); the southernmost port, Thoothukudi, is near the southern tip of India (1); the west-coast ports are fairly evenly spaced from Mumbai south to Kochi (1)

    Award one mark for each valid descriptive point, up to a maximum of 3 marks. Credit evidence from Figure 1 such as named ports, compass directions, coasts, seas or latitudes (allow latitudes within 1 degree). Count the ports as Figure 1 shows them: Mumbai and Chennai have two each, so there are six on each coast. Do not credit a list of port names with no pattern described. Do not credit explanation (e.g. why ports grew where they did). Accept any other appropriate response.

Question 4

4 marks

For a named emerging country, explain two ways its social context affects its development.

Social context includes features such as the size and age of the population, education, health and inequality.

Model answer

India: first, India has trained very large numbers of engineering and IT graduates, many of whom speak English. This skilled workforce has helped IT companies grow in cities such as Bengaluru and has attracted foreign firms to set up offices there, creating well-paid jobs.

Second, only about a third of women in India are in the labour force. This means that a large share of India's potential workers are not earning, which slows the growth of the economy and keeps many households poorer than they could be.

Explanation

Pick two different social features from your case study, such as education, the size of the workforce, health or inequality, and explain how each one helps or holds back development. Each way needs a point and a development. Answers that do not refer to a named emerging country are limited to 3 marks.

Mark scheme
  1. 1 mark

    Identifies a first social feature and its effect, e.g. a large young workforce / many university graduates / low female employment / large gaps in education or health between groups

    Max 3 if the answer is generic and makes no reference to a named emerging country. Examples: India has a very large working-age population (1) which provides a big supply of workers and attracts labour-intensive industries such as clothing and electronics assembly (1). India trains large numbers of engineering and IT graduates (1) who have helped Indian IT companies and foreign firms grow in cities such as Bengaluru (1). Only about a third of Indian women are in the labour force (1) so a large share of potential workers are not earning, which slows economic growth (1). Many people in rural areas have poor access to good schools and health care (1) which limits their skills and the jobs they can do (1). China's long period of low birth rates means its workforce is now shrinking (1) which is raising wages and making some factories move to other countries (1). Credit equivalent detail for any other valid emerging country. Accept any other appropriate response.

  2. 1 mark

    Develops the first way, explaining the effect on development

    The development must explain how the feature helps or hinders development (jobs, skills, investment, productivity, growth). Both positive and negative effects are creditable.

  3. 1 mark

    Identifies a second, different social feature and its effect

    The two ways must be different. Do not credit the same idea twice in different words.

  4. 1 mark

    Develops the second way

    As for the first development mark. No mark is awarded simply for naming the country.

Ready to try the rest? Every answer you write is marked against the mark scheme, so you can see exactly where the marks are.

Study Helper Hints first, answers after you try

Stuck on this one? Ask for a hint and I’ll point you in the right direction, without giving the answer away. Once you’ve checked your answer, I’ll show you how the marks are awarded.