
Level:
Correct: 0
Incorrect: 0
Marks: 0/0
Exam Practice
Course:
Topics:
Edexcel GCSE Geography B (Paper 1) Smart practice A mixed round aimed at your weak spots
Avg
score:
–
Topics
done:
0/23

A megacity: population growth and spatial growth

Practise 26 exam-style questions on A megacity: population growth and spatial growth for Edexcel GCSE Geography B (Paper 1). Write your answer as you would in the exam and get it marked in seconds against the mark scheme, point by point, with the Study Helper on hand if you get stuck.

  • 26 questions
  • 1–8 marks each
  • Instant marking
  • No sign-up needed
20 questions, marked as you go

Sample questions with model answers

Here are 4 of the questions in this topic, each with a model answer, an explanation of why it earns the marks and the mark scheme an examiner would use.

Question 1

1 mark

For a megacity in a developing or emerging country that you have studied, state one example of economic investment that has attracted people to live and work there.

Model answer

Investment in new office blocks for banks and companies at Bandra Kurla Complex, a newer business district in Mumbai.

Explanation

Investment by governments and companies creates jobs, and jobs are the main pull factor for migrants. Learn two or three specific examples of investment in your megacity, both past (such as Mumbai's cotton mills) and present (such as its port, offices or new metro lines). A vague answer such as 'money is invested' does not gain the mark.

Mark scheme
  1. 1 mark

    Any valid example of investment (a project, industry, firm or type of investment) in the chosen megacity, e.g. for Mumbai: the port (Jawaharlal Nehru Port), the cotton mills of the past, banks and offices in the CBD or Bandra Kurla Complex, the film industry (Bollywood), Metro Line 3, Navi Mumbai International Airport; for Lagos: Lekki Deep Sea Port, the Lagos Rail Mass Transit lines, Eko Atlantic

    Credit any appropriate example for the megacity the student has studied, including a type of investment that clearly applies to it (e.g. 'foreign companies building factories in the city'). There is no mark for simply naming the megacity. Do not accept 'money' or 'investment' with no example. Accept any other appropriate response.
Question 2

2 marks

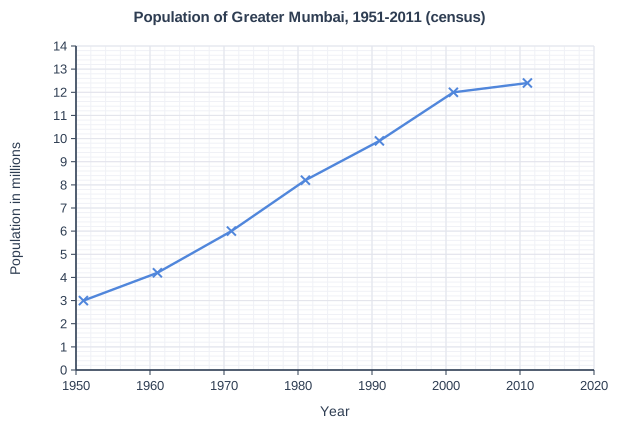
Study Figure 1, which shows the population of Greater Mumbai, India, at each census from 1951 to 2011 (Census of India data, rounded to the nearest 0.1 million).

Calculate the percentage increase in the population of Greater Mumbai between 1951 and 1981.

Answer to one decimal place. Show your working.

Population of Greater Mumbai, 1951-2011 (census). Line graph of population in millions (y-axis, 0 to 14) against year (x-axis, 1950 to 2020). The line joins the points (1951, 3), (1961, 4.2), (1971, 6), (1981, 8.2), (1991, 9.9), (2001, 12), (2011, 12.4).

Model answer

Increase = 8.2 - 3.0 = 5.2 million
5.2 ÷ 3.0 × 100 = 173.33...
Percentage increase = 173.3%

Explanation

Percentage increase = (new value - original value) ÷ original value × 100, using 3.0 million for 1951 and 8.2 million for 1981. Greater Mumbai's population almost trebled in these 30 years, a period of rapid rural-urban migration. Common errors are dividing by the 1981 value or forgetting to take away the original 100%.

Mark scheme
  1. 1 mark

    Method: (8.2 - 3.0) ÷ 3.0 × 100 / 5.2 ÷ 3.0 × 100

    Correct answer 173.3%. Correct answer with no working scores full marks (2). Award 1 mark for a correct method using readings within the accepted ranges (2.9 to 3.1 million for 1951 and 8.1 to 8.3 million for 1981) when there is an arithmetic error or the answer is not given to one decimal place. Values from Figure 1: 3.0 million (1951) and 8.2 million (1981). Accept any other correct method, e.g. 8.2 ÷ 3.0 × 100 = 273.3, then 273.3 - 100 = 173.3.

  2. 1 mark

    173.3(%)

    Accept readings from 2.9 to 3.1 million (1951) and from 8.1 to 8.3 million (1981), half a gridline either side of the plotted values. Award this mark for the answer worked correctly, to one decimal place, from the student's own readings within these ranges: answers from 161.3% to 186.2%, e.g. 173.3% from 3.0 and 8.2. Units are not required. Must be given to one decimal place: do not credit 173 or 173.33 for this mark. Do not credit 63.4 (the increase divided by the 1981 value) or 273.3 (the 1981 value as a percentage of the 1951 value).

Question 3

2 marks

Explain one way in which land reclamation has been used to provide space for a growing megacity.

Model answer

Mumbai began as seven separate islands. Land reclamation filled in the shallow water between them, creating one continuous area of land on which the growing city could build its port, CBD and housing.

Explanation

Megacities on coasts, islands or lagoons often run short of building land, so they create new land by reclaiming it from the sea or from marshes. One mark is for the way and one for explaining how it gives space for growth. A good named example strengthens the answer.

Mark scheme
  1. 1 mark

    Identifies a valid use of reclamation, e.g. islands joined together to make one area of land / new land built out into the sea or a lagoon / marshes or mangroves drained and filled in for building

    Examples: In Mumbai, the original seven islands were joined by land reclamation (1), creating one continuous area of land on which the city could grow (1). In Lagos, Eko Atlantic is being built on land reclaimed from the sea behind a sea wall (1), creating new space for offices and housing close to the business district (1). Marshland and mangroves at the edge of a coastal city are drained and filled in (1) so that new housing, roads and industry can be built where there was no usable land before (1). Credit any appropriate named example. Accept any other appropriate response.

  2. 1 mark

    Develops the point, explaining how it provides space for growth

    Do not credit environmental effects of reclamation (e.g. loss of mangroves) unless linked to providing space. Do not credit a second, different way.

Question 4

4 marks

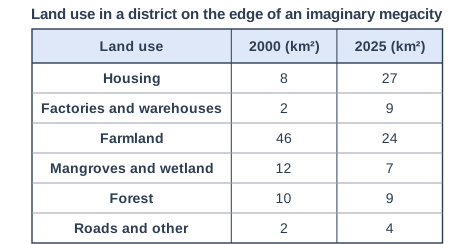
Study Figure 1, which shows land use in a district on the edge of an imaginary megacity, measured from satellite images taken in 2000 and 2025 (data written for this course).

Using Figure 1, suggest two ways in which the changes in land use are linked to the megacity's population growth.

Land use in a district on the edge of an imaginary megacity. Table with columns "Land use", "2000 (km²)", "2025 (km²)". Land use: Housing; 2000 (km²): 8; 2025 (km²): 27 | Land use: Factories and warehouses; 2000 (km²): 2; 2025 (km²): 9 | Land use: Farmland; 2000 (km²): 46; 2025 (km²): 24 | Land use: Mangroves and wetland; 2000 (km²): 12; 2025 (km²): 7 | Land use: Forest; 2000 (km²): 10; 2025 (km²): 9 | Land use: Roads and other; 2000 (km²): 2; 2025 (km²): 4.

Model answer

Housing more than trebled from 8 km² to 27 km² because the growing population needs more homes, and land on the edge of the city is cheaper and easier to find than land in the crowded centre. Secondly, factories and warehouses increased from 2 km² to 9 km². A larger population is a bigger market and workforce, so firms build large warehouses on cheap land near the edge of the city.

Explanation

This is how population growth changes land use at the urban-rural fringe: farmland, wetland and forest are replaced by housing, industry and roads. Each link earns 1 mark for the change (with data from Figure 1) and 1 for explaining how it is connected to the growing population. Answers without data from the table are limited to 3 marks.

Mark scheme
  1. 1 mark

    Identifies a first link using evidence from Figure 1, e.g. housing grew from 8 to 27 km² / factories and warehouses grew from 2 to 9 km² / farmland fell from 46 to 24 km² / mangroves and wetland fell from 12 to 7 km² / roads doubled from 2 to 4 km²

    Max 3 if no data or evidence from Figure 1 is used. Examples: Housing more than trebled from 8 to 27 km² (1) because the growing population needs more homes and land on the edge of the city is cheaper and more available than in the centre (1). Factories and warehouses grew from 2 to 9 km² (1) because a bigger population is a larger market and workforce, and firms move out from the crowded centre to large, cheap plots near highways (1). Farmland fell by 22 km² (1) because it was sold and built on for housing and industry as the city spread outwards (1). Mangroves and wetland fell from 12 to 7 km² (1) because they were drained or reclaimed to provide more building land for the growing city (1). Roads doubled from 2 to 4 km² (1) to connect new housing to jobs in the city for commuters (1). Accept any other appropriate response.

  2. 1 mark

    Develops the first link, explaining how it is connected to population growth

    The development must explain the connection to population growth (more homes, jobs, services or transport needed). Repeating the data is not development.

  3. 1 mark

    Identifies a second, different link using evidence from Figure 1

    Must be a different change from the first. Do not credit 'housing increased' and 'farmland decreased' as two links if both are explained only as 'farmland was built on for housing' (no double credit).

  4. 1 mark

    Develops the second link

    As for the first link.

Ready to try the rest? Every answer you write is marked against the mark scheme, so you can see exactly where the marks are.

Study Helper Hints first, answers after you try

Stuck on this one? Ask for a hint and I’ll point you in the right direction, without giving the answer away. Once you’ve checked your answer, I’ll show you how the marks are awarded.