
Level:
Correct: 0
Incorrect: 0
Marks: 0/0
Exam Practice
Course:
Topics:
Edexcel GCSE Geography B (Paper 1) Smart practice A mixed round aimed at your weak spots
Avg
score:
–
Topics
done:
0/23

The Earth's layered structure and plate movement

Practise 26 exam-style questions on The Earth's layered structure and plate movement for Edexcel GCSE Geography B (Paper 1). Write your answer as you would in the exam and get it marked in seconds against the mark scheme, point by point, with the Study Helper on hand if you get stuck.

  • 26 questions
  • 1–8 marks each
  • Instant marking
  • No sign-up needed
20 questions, marked as you go

Sample questions with model answers

Here are 4 of the questions in this topic, each with a model answer, an explanation of why it earns the marks and the mark scheme an examiner would use.

Question 1

1 mark

Study Figure 1, which shows a cross-section through a plate margin.

Identify what is shown by the arrows labelled C in Figure 1.

Choose your answer.

  • A Plates moving apart at the surface
  • B Lava flowing down the side of a volcano
  • C A convection current in the mantle
  • D An oceanic plate sinking into the mantle
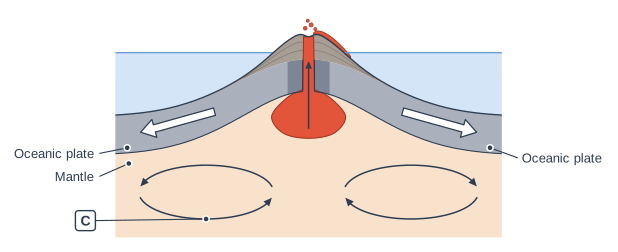
Cross-section through a plate margin. Two layers of rock under the sea have arrows pointing away from each other (left and right). Between them is a gap filled by molten rock, which rises in a column from a blob of molten rock in the layer below; an arrow in the gap points up. The strips of rock right next to the gap are shaded darker. The sea floor rises towards the gap from both sides. Above the gap a low, wide hill with gentle slopes rises above sea level, with a red tongue of molten rock running down its right-hand side. In the lowest layer there are two oval loops of arrows: under the gap the arrows point up, along the top of each loop they point outwards away from the gap, and they sink again at the far ends. Label C points to the loop of arrows in the left half of the lowest layer; the label "Oceanic plate" points to the left-hand layer of rock under the sea; the label "Oceanic plate" points to the right-hand layer of rock under the sea; the label "Mantle" points to the layer below the plates.

Model answer

C

Explanation

The oval loop of arrows labelled C is in the mantle beneath the plates: hot rock rises under the margin, spreads out beneath the plate, cools and sinks again. This circular movement is a convection current. A common error is to confuse it with the arrows on the plates, which show the direction the plates move.

Mark scheme
  1. 1 mark

    C (A convection current in the mantle)

    Accept the letter or the option written out; do not credit more than one answer. A is incorrect: plate movement is shown by the outlined arrows on the plates, not by the loop of arrows in the mantle. B is incorrect: the lava flow is shown on the side of the volcano above sea level. D is incorrect: no plate is sinking in Figure 1; the plates are moving apart. All other answers are incorrect.
Question 2

2 marks

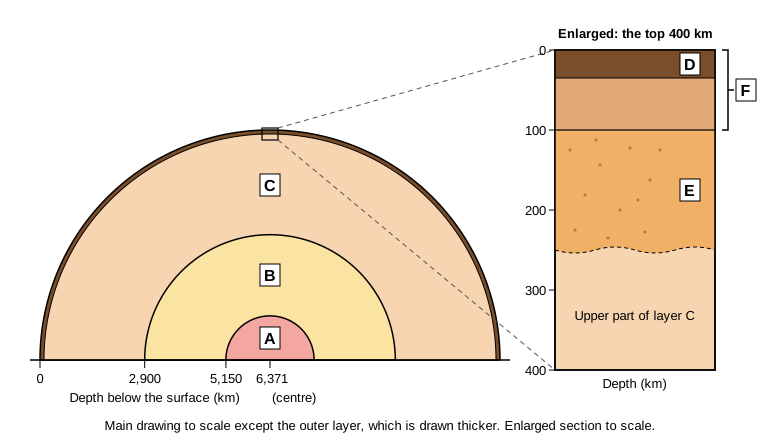
Study Figure 1, which is a cross-section through the Earth. The radius of the Earth is 6,371 km. Layers A and B together form the core.

Using Figure 1, calculate the percentage of the Earth's radius that is made up of the core.

Show your working. Answer to one decimal place.

A cross-section of half of the Earth drawn as a semicircle. Three layers are lettered A (at the centre), B and C, from the centre outwards, with a thin dark outer layer. A depth scale along the flat base marks 0, 2,900, 5,150 and 6,371 km (the centre). An enlarged section shows the top 400 km: a thin top layer lettered D (about 35 km thick), a layer lettered E from about 100 km to about 250 km deep with a wavy dashed lower edge, and the upper part of layer C below it. A bracket lettered F covers the top 100 km. A note under the drawing says that the main drawing is to scale except the outer layer, which is drawn thicker, and that the enlarged section is to scale.

Model answer

Radius of the core = 6,371 - 2,900 = 3,471 km
3,471 ÷ 6,371 × 100 = 54.48...
= 54.5%

Explanation

The core starts 2,900 km below the surface, so its radius is 6,371 - 2,900 = 3,471 km, which is 54.5% of the Earth's radius. A common error is to divide 2,900 by 6,371, which gives the share of the radius taken up by the mantle and crust instead.

Mark scheme
  1. 1 mark

    Method: radius of the core = 6,371 - 2,900 = 3,471 km, then 3,471 ÷ 6,371 × 100 (correct answer 54.5%)

    Correct answer: 54.5%; units are not required. Correct answer with no working scores full marks (2). Award this method mark for a correct method when the answer is not given to one decimal place (e.g. 54.48 or 54), for correct working with an arithmetic slip, or for (6,371 - 2,900) ÷ 6,371 × 100 written out. Also award it for 100 - (2,900 ÷ 6,371 × 100). Do not award the method mark for 2,900 ÷ 6,371 × 100 = 45.5% on its own (that is the depth of the mantle and crust, not the core).

  2. 1 mark

    54.5 (%)

    Must be given to one decimal place: do not credit 54, 55 or 54.48 for this mark.

Question 3

3 marks

Explain one reason why the inner core is solid even though it is hotter than the outer core.

Model answer

The inner core is under enormous pressure because of the weight of all the layers above it. This pressure squeezes the iron and nickel so tightly together that their melting temperature is raised above the actual temperature, so the inner core stays solid even though it is about 5,000-6,000 °C.

Explanation

The first mark is for identifying pressure; the other two are for explaining how pressure raises the melting point so that the metal stays solid. Answers that only say the inner core is made of iron do not explain the difference, because the liquid outer core is also mostly iron. Temperature alone cannot be the reason, because the inner core is the hottest layer.

Mark scheme
  1. 1 mark

    Identifies the reason: the pressure at the centre of the Earth is much greater / the inner core is under enormous pressure from the weight of all the layers above it

    Examples: The pressure at the centre of the Earth is enormous (1) because of the weight of all the rock and metal above it (1), which raises the temperature at which iron and nickel melt, so the inner core stays solid even at about 5,000-6,000 °C (1). The inner core is under greater pressure than the outer core (1) which squeezes the iron and nickel so tightly together (1) that they cannot become liquid even though they are hotter (1). Accept any other appropriate response.

  2. 2 marks

    Up to two further marks for linked development of the same reason (1 + 1), e.g. the pressure squeezes the metal atoms together / raises the melting point of the iron and nickel / so the metal cannot melt even at very high temperatures

    The development must explain how the pressure keeps the inner core solid. Do not credit 'it is made of iron and nickel' as a reason on its own: the outer core is made of the same metals and is liquid.

Question 4

4 marks

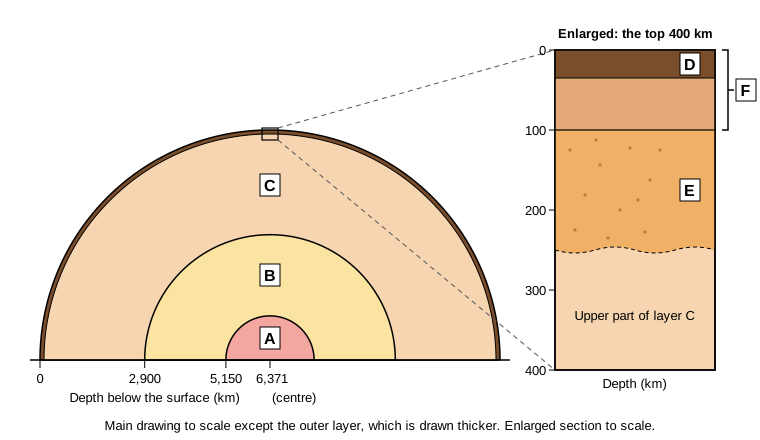
Study Figure 1, which is a cross-section through the Earth.

Explain one advantage and one disadvantage of using a cross-section, such as Figure 1, to show the structure of the Earth.

A cross-section of half of the Earth drawn as a semicircle. Three layers are lettered A (at the centre), B and C, from the centre outwards, with a thin dark outer layer. A depth scale along the flat base marks 0, 2,900, 5,150 and 6,371 km (the centre). An enlarged section shows the top 400 km: a thin top layer lettered D (about 35 km thick), a layer lettered E from about 100 km to about 250 km deep with a wavy dashed lower edge, and the upper part of layer C below it. A bracket lettered F covers the top 100 km. A note under the drawing says that the main drawing is to scale except the outer layer, which is drawn thicker, and that the enlarged section is to scale.

Model answer

One advantage is that the cross-section shows every layer in order from the crust to the inner core and is drawn to scale, so the thickness of the layers can be compared; for example, it is clear that the core makes up over half of the Earth's radius.

One disadvantage is that the crust, lithosphere and asthenosphere are too thin to show at the same scale as the core. They have to be drawn thicker than they really are or shown in a separate enlargement, which can give a misleading impression of how thick they are.

Explanation

Each part earns 1 mark for identifying the advantage or disadvantage and 1 for explaining why it matters. The best answers refer to Figure 1, such as the enlarged section needed to show the thin outer layers. Vague points such as 'it is easy to read' need developing to earn the second mark.

Mark scheme
  1. 1 mark

    Identifies an advantage, e.g. it shows all the layers in their correct order from the surface to the centre / it is drawn to scale

    Examples (advantages): It shows every layer in order from the crust to the inner core (1), so the relative thickness of the layers can be compared at a glance, e.g. the core makes up over half of the Earth's radius (1). It is drawn to scale with a depth scale (1), so depths and thicknesses can be read off or calculated (1). Accept any other appropriate response.

  2. 1 mark

    Explains the advantage, e.g. so the relative sizes of the layers can be compared / so depths and thicknesses can be measured or calculated

  3. 1 mark

    Identifies a disadvantage, e.g. thin layers such as the crust, lithosphere and asthenosphere are too thin to show at the same scale / boundaries are drawn as sharp lines / it does not show properties such as temperature or density

    Examples (disadvantages): The crust, lithosphere and asthenosphere are too thin to see at the same scale as the core (1), so they have to be exaggerated or shown in a separate enlargement, which can give a misleading idea of their thickness (1). Boundaries are drawn as sharp lines (1) although some, such as the base of the asthenosphere, are gradual (1). It shows only the position of the layers (1), so properties such as temperature, density or physical state need a separate graph or table (1). Accept any other appropriate response.

  4. 1 mark

    Explains the disadvantage, e.g. so they must be exaggerated or shown in an enlarged section, which can be misleading / so a separate graph or table is needed

Ready to try the rest? Every answer you write is marked against the mark scheme, so you can see exactly where the marks are.

Study Helper Hints first, answers after you try

Stuck on this one? Ask for a hint and I’ll point you in the right direction, without giving the answer away. Once you’ve checked your answer, I’ll show you how the marks are awarded.