Level:
Correct: 0
Incorrect: 0
Marks: 0/0
Exam Practice
Course:
Topics:
Edexcel GCSE Geography B (Paper 1) Smart practice A mixed round aimed at your weak spots
Avg
score:
–
Topics
done:
0/23

Human activity and future climate change

Practise 28 exam-style questions on Human activity and future climate change for Edexcel GCSE Geography B (Paper 1). Write your answer as you would in the exam and get it marked in seconds against the mark scheme, point by point, with the Study Helper on hand if you get stuck.

  • 28 questions
  • 1–8 marks each
  • Instant marking
  • No sign-up needed
20 questions, marked as you go

Sample questions with model answers

Here are 4 of the questions in this topic, each with a model answer, an explanation of why it earns the marks and the mark scheme an examiner would use.

Question 1

1 mark

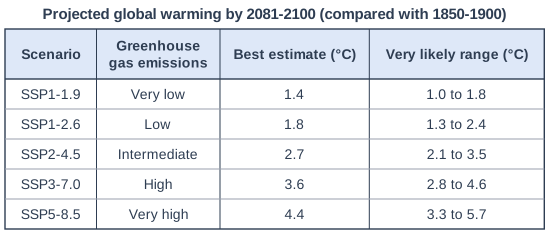
Figure 1 shows projections of global warming by 2081-2100 for five greenhouse gas emissions scenarios (IPCC, 2021).

Identify the scenario with the widest very likely range of warming.

Choose your answer.

  • A SSP1-1.9
  • B SSP2-4.5
  • C SSP3-7.0
  • D SSP5-8.5
Projected global warming by 2081-2100 (compared with 1850-1900). Table with columns "Scenario", "Greenhouse gas emissions", "Best estimate (°C)", "Very likely range (°C)". Scenario: SSP1-1.9; Greenhouse gas emissions: Very low; Best estimate (°C): 1.4; Very likely range (°C): 1.0 to 1.8 | Scenario: SSP1-2.6; Greenhouse gas emissions: Low; Best estimate (°C): 1.8; Very likely range (°C): 1.3 to 2.4 | Scenario: SSP2-4.5; Greenhouse gas emissions: Intermediate; Best estimate (°C): 2.7; Very likely range (°C): 2.1 to 3.5 | Scenario: SSP3-7.0; Greenhouse gas emissions: High; Best estimate (°C): 3.6; Very likely range (°C): 2.8 to 4.6 | Scenario: SSP5-8.5; Greenhouse gas emissions: Very high; Best estimate (°C): 4.4; Very likely range (°C): 3.3 to 5.7.

Model answer

D (SSP5-8.5)

Explanation

The width of a range is the highest value minus the lowest: 5.7 - 3.3 = 2.4 °C for SSP5-8.5, wider than any other scenario. A common error is to choose the scenario with the highest best estimate without working out the width of each range. The higher the emissions, the more uncertain the amount of warming becomes.

Mark scheme
  1. 1 mark

    D (SSP5-8.5)

    Accept the letter or the option written out; do not credit more than one answer. All other answers are incorrect. The very likely range for SSP5-8.5 is 3.3 to 5.7 °C, a width of 2.4 °C. A is incorrect: SSP1-1.9 has the narrowest range (1.0 to 1.8 °C, a width of 0.8 °C). B is incorrect: SSP2-4.5 has a width of 1.4 °C (2.1 to 3.5 °C). C is incorrect: SSP3-7.0 has a width of 1.8 °C (2.8 to 4.6 °C).
Question 2

2 marks

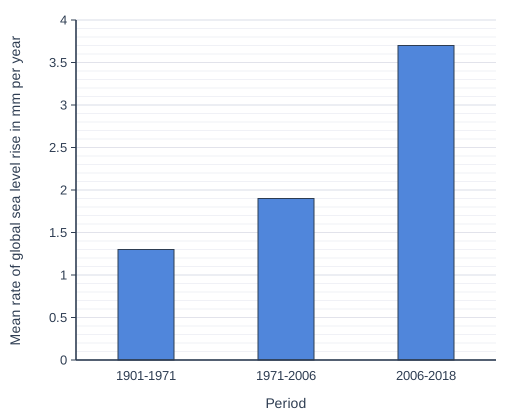
Figure 1 shows the mean rate of global sea level rise in three periods since 1901 (IPCC, 2021).

Calculate the percentage increase in the rate of sea level rise between 1901-1971 and 2006-2018.

Answer to one decimal place.

Bar chart of mean rate of global sea level rise in mm per year for each period: 1901-1971 1.3, 1971-2006 1.9, 2006-2018 3.7.

Model answer

Increase in rate = 3.7 - 1.3 = 2.4 mm per year
2.4 ÷ 1.3 × 100 = 184.62 = 184.6%

Explanation

Find the increase (2.4), divide by the original rate (1.3) and multiply by 100. A percentage increase can be more than 100%: here the rate has nearly trebled. A common error is to give 3.7 as a percentage of 1.3 (284.6%) instead of the increase.

Mark scheme
  1. 1 mark

    Correct method: (3.7 - 1.3) ÷ 1.3 × 100 = 2.4 ÷ 1.3 × 100 (answer 184.6%)

    Accept 184.6 or 184.6%. Correct answer with no working scores both marks. Award this method mark for a correct percentage increase method using readings within the accepted ranges (see the answer mark), even if the final answer is wrong or not given to one decimal place.

  2. 1 mark

    184.6 (%)

    Accept readings from 1.25 to 1.35 mm per year (1901-1971) and from 3.65 to 3.75 mm per year (2006-2018), half a gridline either side of the bar heights. Award this mark for the answer worked correctly, to one decimal place, from the student's own readings within these ranges: answers from 170.4% to 200.0%, e.g. 184.6% from 1.3 and 3.7. Must be given to one decimal place: do not credit 185 or 184.62 for this mark. Do not credit 284.6 (3.7 as a percentage of 1.3) or 64.9 (dividing by 3.7).

Question 3

3 marks

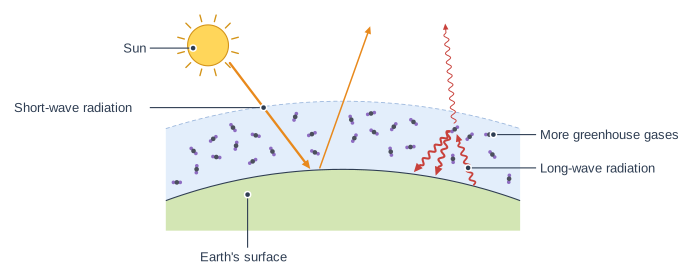
Figure 1 shows the enhanced greenhouse effect.

Explain one way in which an increase in greenhouse gases in the atmosphere leads to global warming.

The enhanced greenhouse effect. A yellow circle at the top left sends a thick orange arrow through a pale blue band to the green ground at the bottom; a thinner orange arrow goes from the ground back up through the band into space. A wavy red arrow rises from the ground into the band, where small molecules are scattered; the band contains many molecules: from there only a thin wavy arrow carries on up into space, while two thick wavy arrows come back down to the ground. The label "Sun" points to the yellow circle at the top left; the label "Short-wave radiation" points to the thick orange arrow from the yellow circle down to the ground; the label "Long-wave radiation" points to the wavy red arrow rising from the ground into the blue band; the label "More greenhouse gases" points to the small molecules scattered through the blue band; the label "Earth's surface" points to the green ground at the bottom.

Model answer

The Sun's short-wave radiation passes through the atmosphere and warms the Earth's surface, which then gives off long-wave radiation. Extra greenhouse gases, such as carbon dioxide from burning fossil fuels, absorb more of this long-wave radiation and re-radiate it back towards the surface. As Figure 1 shows, less heat escapes to space, so the surface and the lower atmosphere warm up.

Explanation

The first mark is for the extra gases absorbing outgoing long-wave radiation, and two more for the linked chain: heat re-radiated back down, less escaping to space, so temperatures rise. A common error is to say that greenhouse gases trap the incoming sunlight, or to describe the hole in the ozone layer.

Mark scheme
  1. 1 mark

    Identifies a valid way, e.g. more greenhouse gases absorb more of the long-wave radiation given off by the Earth's surface

    Examples: More greenhouse gases such as carbon dioxide and methane absorb more of the long-wave radiation given off by the Earth's surface (1); they re-radiate this heat in all directions, so more is sent back down towards the surface (1) and less escapes to space, so the surface and lower atmosphere warm up (1). Accept any other appropriate response, including use of Figure 1 (e.g. the thin arrow escaping to space and the two thick arrows coming back down).

  2. 2 marks

    Up to two further marks for linked development (1 + 1), e.g. the gases re-radiate heat back towards the surface / less heat escapes to space / so the Earth's surface and lower atmosphere warm up

    The development must explain the same process. Do not credit answers that say greenhouse gases trap incoming sunlight (short-wave radiation) or that confuse the greenhouse effect with the ozone hole.

Question 4

4 marks

Explain two ways in which the oceans provide evidence that the global climate is getting warmer.

Model answer

One way is rising sea level. Global sea level has risen by about 20 cm since 1900 and is now rising by about 4-5 mm a year, because warmer water expands and melting glaciers and ice sheets add water to the oceans.

A second way is the shrinking of Arctic sea ice. The extent of sea ice left at the end of each summer has fallen by about 12% per decade since 1979, because warmer air and sea water melt more of the ice each summer.

Explanation

Each way earns 1 mark and its explanation 1 more, so two different, developed pieces of evidence are needed. Good answers say what is changing and why that change shows warming. A common error is to say that melting sea ice raises sea level.

Mark scheme
  1. 1 mark

    Identifies a first way, e.g. sea level is rising / the oceans are warming (ocean heat content is rising) / Arctic sea ice is shrinking / marine heatwaves are more frequent

    Examples: Global sea level is rising, by about 20 cm since 1900 and now about 4-5 mm a year (1), because warmer water expands and melting land ice adds water to the oceans (1). Measurements show the oceans are storing more heat, with record ocean heat content in 2025 (1), because they absorb most of the extra heat trapped by greenhouse gases (1). The extent of Arctic sea ice at its September minimum is shrinking, by about 12% per decade since 1979 (1), because warmer air and water melt more ice (1). Marine heatwaves have about doubled in frequency since the 1980s (1), showing that sea temperatures are rising (1). Accept any other appropriate response.

  2. 1 mark

    Develops the first way

    The development must explain how the change shows that the climate is warming.

  3. 1 mark

    Identifies a second, different way

    The two ways must be different. Sea level rise and ocean warming can be two ways if each is explained differently (e.g. rising sea level measured by tide gauges and satellites; rising water temperatures measured by floats).

  4. 1 mark

    Develops the second way

    The development must explain how the second change shows warming. Do not credit melting sea ice as a cause of sea level rise.

Ready to try the rest? Every answer you write is marked against the mark scheme, so you can see exactly where the marks are.

Study Helper Hints first, answers after you try

Stuck on this one? Ask for a hint and I’ll point you in the right direction, without giving the answer away. Once you’ve checked your answer, I’ll show you how the marks are awarded.