
Level:
Correct: 0
Incorrect: 0
Marks: 0/0
Exam Practice
Course:
Topics:
Edexcel GCSE Geography B (Paper 1) Smart practice A mixed round aimed at your weak spots
Avg
score:
–
Topics
done:
0/23

Defining and measuring development

Practise 28 exam-style questions on Defining and measuring development for Edexcel GCSE Geography B (Paper 1). Write your answer as you would in the exam and get it marked in seconds against the mark scheme, point by point, with the Study Helper on hand if you get stuck.

  • 28 questions
  • 1–12 marks each
  • Instant marking
  • No sign-up needed
20 questions, marked as you go

Sample questions with model answers

Here are 4 of the questions in this topic, each with a model answer, an explanation of why it earns the marks and the mark scheme an examiner would use.

Question 1

1 mark

Study Figure 1, which shows development data for six countries in 2023 (source: UNDP Human Development Report 2025).

Calculate the difference in life expectancy between Sri Lanka and Equatorial Guinea.
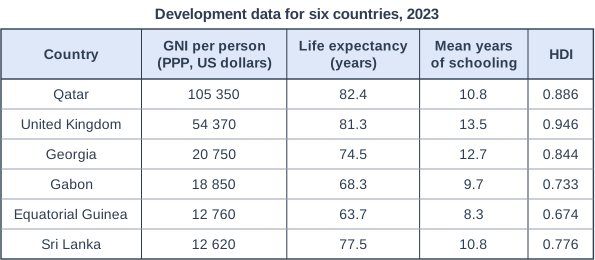
Development data for six countries, 2023. Table with columns "Country", "GNI per person (PPP, US dollars)", "Life expectancy (years)", "Mean years of schooling", "HDI". Country: Qatar; GNI per person (PPP, US dollars): 105 350; Life expectancy (years): 82.4; Mean years of schooling: 10.8; HDI: 0.886 | Country: United Kingdom; GNI per person (PPP, US dollars): 54 370; Life expectancy (years): 81.3; Mean years of schooling: 13.5; HDI: 0.946 | Country: Georgia; GNI per person (PPP, US dollars): 20 750; Life expectancy (years): 74.5; Mean years of schooling: 12.7; HDI: 0.844 | Country: Gabon; GNI per person (PPP, US dollars): 18 850; Life expectancy (years): 68.3; Mean years of schooling: 9.7; HDI: 0.733 | Country: Equatorial Guinea; GNI per person (PPP, US dollars): 12 760; Life expectancy (years): 63.7; Mean years of schooling: 8.3; HDI: 0.674 | Country: Sri Lanka; GNI per person (PPP, US dollars): 12 620; Life expectancy (years): 77.5; Mean years of schooling: 10.8; HDI: 0.776.

Model answer

77.5 - 63.7 = 13.8 years

Explanation

Subtract the lower life expectancy (Equatorial Guinea, 63.7 years) from the higher (Sri Lanka, 77.5 years). The two countries have almost the same GNI per person, so this large gap shows how a single income measure can hide big differences in people's health.

Mark scheme
  1. 1 mark

    13.8 (years) (77.5 - 63.7)

    Correct answer with no working scores full marks. Accept 13.8, with or without units; also accept -13.8. The answer is exact, so do not credit a rounded value such as 14. Do not accept 77.5 - 63.7 left uncalculated.
Question 2

2 marks

Explain one reason why a measure of inequality, such as the Gini coefficient, is useful when comparing the development of countries.

Model answer

GDP per capita is only an average, so it can hide the fact that a small rich group earns most of the income. The Gini coefficient shows how evenly income is shared, so it reveals whether most people in a country actually benefit from its wealth.

Explanation

One mark is for the reason and one for its development. Simply defining the Gini coefficient does not explain why it is useful; link it to what averages such as GDP per capita hide.

Mark scheme
  1. 1 mark

    Identifies a valid reason, e.g. averages such as GDP per capita hide how income is shared / it shows whether most people benefit from a country's wealth / countries with similar average incomes can have very different levels of inequality

    Examples: GDP per capita is an average (1) and the Gini coefficient shows whether wealth is shared fairly or held by a rich minority (1). Two countries with similar GDP per capita can have very different Gini coefficients (1), so the one with more inequality is likely to have more people living in poverty (1). It shows whether economic growth is reaching the poorest people (1), so it helps to judge whether development is improving most people's lives (1). Accept any other appropriate response.

  2. 1 mark

    Develops the reason

    Do not credit a definition of the Gini coefficient on its own (e.g. '0 means complete equality'); the answer must say why it helps to compare development.

Question 3

3 marks

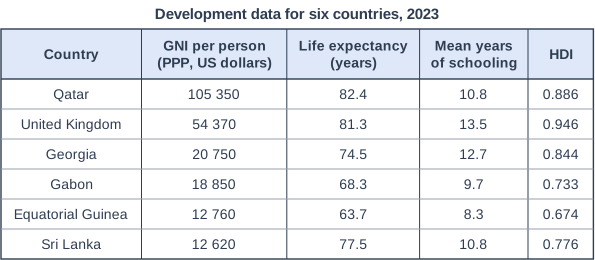
Study Figure 1, which shows development data for six countries in 2023 (source: UNDP Human Development Report 2025).

Equatorial Guinea and Sri Lanka have almost the same GNI per person, but Sri Lanka has a much higher HDI.

Suggest one reason for this difference.

Development data for six countries, 2023. Table with columns "Country", "GNI per person (PPP, US dollars)", "Life expectancy (years)", "Mean years of schooling", "HDI". Country: Qatar; GNI per person (PPP, US dollars): 105 350; Life expectancy (years): 82.4; Mean years of schooling: 10.8; HDI: 0.886 | Country: United Kingdom; GNI per person (PPP, US dollars): 54 370; Life expectancy (years): 81.3; Mean years of schooling: 13.5; HDI: 0.946 | Country: Georgia; GNI per person (PPP, US dollars): 20 750; Life expectancy (years): 74.5; Mean years of schooling: 12.7; HDI: 0.844 | Country: Gabon; GNI per person (PPP, US dollars): 18 850; Life expectancy (years): 68.3; Mean years of schooling: 9.7; HDI: 0.733 | Country: Equatorial Guinea; GNI per person (PPP, US dollars): 12 760; Life expectancy (years): 63.7; Mean years of schooling: 8.3; HDI: 0.674 | Country: Sri Lanka; GNI per person (PPP, US dollars): 12 620; Life expectancy (years): 77.5; Mean years of schooling: 10.8; HDI: 0.776.

Model answer

Much of Equatorial Guinea's income comes from oil and gas, an industry that employs relatively few people, so the wealth is not shared widely across the population. Many people therefore cannot afford good health care or schooling, so life expectancy is only 63.7 years compared with 77.5 years in Sri Lanka, and mean years of schooling are lower (8.3 compared with 10.8). Because the HDI includes health and education as well as income, Equatorial Guinea's HDI is much lower.

Explanation

One mark is for a reason and two for developing it, ideally linked to the health and education parts of the HDI. Using the data (life expectancy 63.7 compared with 77.5 years) strengthens the development. A common error is to say that one country is 'richer', which the GNI data show is not the case.

Mark scheme
  1. 1 mark

    Identifies a valid reason, e.g. income is shared less equally in Equatorial Guinea / much of Equatorial Guinea's income comes from oil and gas, which benefits relatively few people / Sri Lanka's government provides free health care and education

    Examples: Much of Equatorial Guinea's national income comes from oil and gas exports (1), so the wealth goes to a small number of people and companies rather than to most of the population (1), which means many people cannot afford good health care, so life expectancy is only 63.7 years compared with 77.5 years in Sri Lanka (1). Sri Lanka's government provides free health care and education (1) so most people can see a doctor and go to school whatever their income (1), giving higher life expectancy and more years of schooling (10.8 compared with 8.3), which raise the HDI (1). Data from Figure 1 can be credited as development. Accept any other appropriate response.

  2. 2 marks

    Up to two further marks for linked development of the same reason (1 + 1), e.g. how it affects health or education and so the HDI

    The development must explain the same reason; a second, different reason earns no further marks. The HDI includes life expectancy and schooling as well as income, so credit answers that link the reason to these parts of the HDI. Do not credit 'Sri Lanka is richer', which the GNI data contradict.

Question 4

4 marks

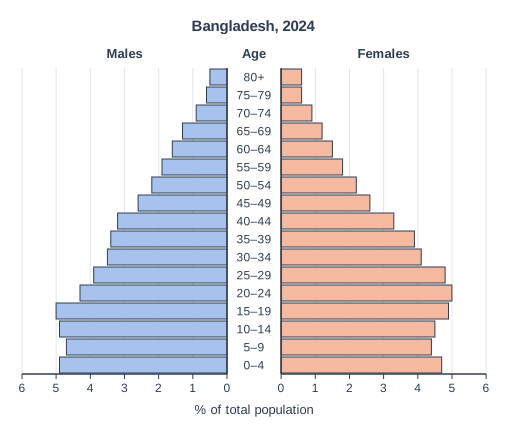
Study Figure 1, which shows the population pyramid of Bangladesh in 2024 (source: World Bank). Bangladesh is an emerging country.

About two-thirds of Bangladesh's population is aged 15 to 64.

Using Figure 1, explain two reasons why Bangladesh has a large proportion of people of working age.

Population pyramid for Bangladesh, 2024. It has horizontal bars for males (blue, to the left) and females (orange, to the right) of a central column of age groups, from 0–4 at the bottom to 80+ at the top. The horizontal scale is "% of total population", from 0 at the centre to 6 at each side, numbered every 1. Values (males, females): 0–4: 4.9, 4.7; 5–9: 4.7, 4.4; 10–14: 4.9, 4.5; 15–19: 5, 4.9; 20–24: 4.3, 5; 25–29: 3.9, 4.8; 30–34: 3.5, 4.1; 35–39: 3.4, 3.9; 40–44: 3.2, 3.3; 45–49: 2.6, 2.6; 50–54: 2.2, 2.2; 55–59: 1.9, 1.8; 60–64: 1.6, 1.5; 65–69: 1.3, 1.2; 70–74: 0.9, 0.9; 75–79: 0.6, 0.6; 80+: 0.5, 0.6 (%).

Model answer

First, Bangladesh's birth rate has fallen quickly. Figure 1 shows that the bars for children aged 0-14 are about the same width as those for young adults aged 15-24, instead of being much wider, so the base of the pyramid has stopped widening. As women have gained more access to education and contraception, families have become smaller, so children make up a smaller share of the population and adults a larger share.

Second, there are few elderly people: the bars for people aged 65 and over are very narrow, together making up under 7% of the population. In the past, life expectancy in Bangladesh was much lower, so few people born before the 1960s have survived to old age. As a result, most of the population is in the working ages between 15 and 64.

Explanation

Each reason earns 1 mark and its development a second. Strong answers link the shape of the pyramid to the fall in fertility and to the small number of elderly people. Because the question says 'Using Figure 1', answers with no evidence from the pyramid score at most 3 marks.

Mark scheme
  1. 1 mark

    Identifies a first reason, e.g. the birth rate (fertility rate) has fallen, so children make up a smaller share / many children born when birth rates were high survived into adulthood because infant mortality fell / there are few elderly people because life expectancy used to be much lower

    Max 3 if no data or evidence from Figure 1 is used. Evidence can be numeric or descriptive, e.g. the bars for children aged 0-14 are about the same width as those for young adults aged 15-24, so the base has stopped widening; the bars for people aged 65 and over are very narrow (under 7% of the population). Readings within half a gridline (plus or minus 0.5 percentage points) of each bar are acceptable, and totals worked from the student's own readings are credited. Examples: The fertility rate has fallen quickly, from about 6.8 children per woman in 1970 to about 2.1 in 2024 (1), so women have fewer children and the youngest age groups are no longer much wider than the young adult groups, leaving a larger share of adults (1). Infant and child mortality fell from the 1970s onwards because of vaccination and better health care (1), so most of the many children born in the 1980s and 1990s survived and are now aged about 25-44, forming large working-age groups (1). Life expectancy was much lower in the past, about 43 years in 1970 (1), so few people born before the 1960s have survived to old age and the age groups over 65 are small (1). Accept any other appropriate response.

  2. 1 mark

    Explains the first reason

    The explanation must link the reason to the large proportion of people aged 15-64.

  3. 1 mark

    Identifies a second, different reason

    The two reasons must be different (e.g. a falling birth rate and a small elderly population).

  4. 1 mark

    Explains the second reason

    As for the first reason.

Ready to try the rest? Every answer you write is marked against the mark scheme, so you can see exactly where the marks are.

Study Helper Hints first, answers after you try

Stuck on this one? Ask for a hint and I’ll point you in the right direction, without giving the answer away. Once you’ve checked your answer, I’ll show you how the marks are awarded.