Practise 27 exam-style questions on Global urbanisation trends and megacities for Edexcel GCSE Geography B (Paper 1). Write your answer as you would in the exam and get it marked in seconds against the mark scheme, point by point, with the Study Helper on hand if you get stuck.
27 questions
1–8 marks each
Instant marking
No sign-up needed
20 questions, marked as you go
Sample questions with model answers
Here are 4 of the questions in this topic, each with a model answer, an explanation of why it earns the marks and the mark scheme an examiner would use.
Question 1
1 mark
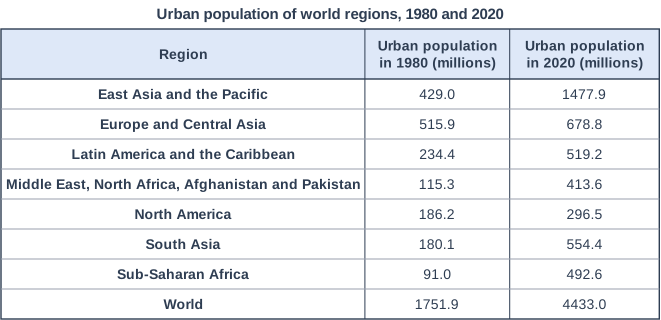
Study Figure 1, which shows the urban population of the world's regions in 1980 and 2020 (World Bank data).
Calculate the mean increase per year in the urban population of South Asia between 1980 and 2020. Give your answer in millions to one decimal place.
Model answer
554.4 - 180.1 = 374.3 million 374.3 ÷ 40 years = 9.4 million people per year
Explanation
The mean increase per year is the total change divided by the number of years (2020 - 1980 = 40 years). Be careful to use South Asia's row, not the World row or Sub-Saharan Africa, and to divide by 40 rather than 4.
Mark scheme
1 mark
9.4 (million people per year) ((554.4 - 180.1) ÷ 40 = 9.36)
Correct answer with no working scores the mark. Accept 9.4 or 9.4 million (per year). Must be given to one decimal place: do not credit 9 or 9.36 for this mark. Do not accept 374.3 (the total increase, not per year) or 93.6 (dividing by 4 decades gives the increase per decade).
Question 2
2 marks
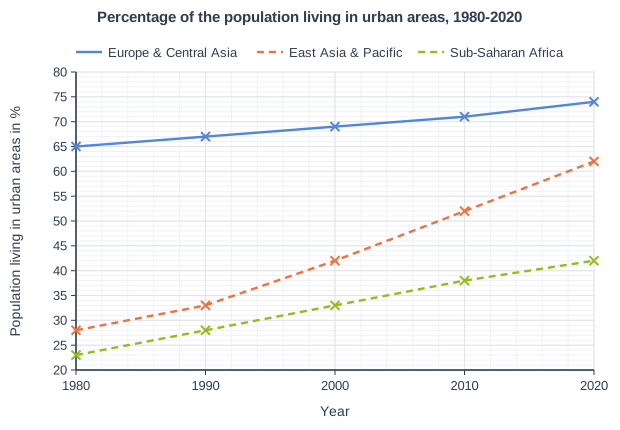
Study Figure 1, which shows the percentage of the population living in urban areas in three world regions between 1980 and 2020 (World Bank data).
Calculate the mean increase per decade in the percentage of the population living in urban areas in East Asia and the Pacific between 1980 and 2020.
Show your working.
Model answer
Increase 1980-2020 = 62 - 28 = 34 percentage points 1980 to 2020 = 4 decades Mean increase per decade = 34 ÷ 4 = 8.5 percentage points per decade
Explanation
Find the total change between the first and last years, then divide by the number of decades (40 years = 4 decades). The most common errors are dividing by 40 (which gives the change per year) or dividing by 5 because there are five plotted points.
Mark scheme
1 mark
Correct method, e.g. (62 - 28) ÷ 4 decades / 34 ÷ 4 (correct answer 8.5 percentage points per decade)
Correct answer: 8.5 (percentage points per decade); units are not required. Correct answer with no working scores full marks (2). Award this method mark for a correct method (the increase divided by the 4 decades) using readings within the accepted ranges (27.5% to 28.5% for 1980 and 61.5% to 62.5% for 2020), even if the final answer is wrong.
1 mark
8.5 (percentage points per decade)
Accept 8.5 or 8.5% per decade. Accept readings from 27.5% to 28.5% (1980) and from 61.5% to 62.5% (2020), half a gridline either side of the plotted values. Award this mark for the answer worked correctly from the student's own readings within these ranges: answers from 8.25 to 8.75, e.g. 8.25 from 61% and 28%. Do not accept 0.85 (the mean increase per year) or 34 (the increase over the whole period, not per decade).
Question 3
2 marks
Explain one reason why projections of the future populations of cities may turn out to be inaccurate.
Model answer
Migration can change suddenly, for example because of a conflict, a natural disaster or an economic crisis. This means far more or far fewer people may move to a city than the projection assumed, so its population could end up very different from the forecast.
Explanation
One mark is for a reason (such as changing migration, falling birth rates or poor census data) and one for explaining why it makes the projection wrong. 'You cannot predict the future' is too vague to earn a mark.
Mark scheme
1 mark
Identifies a valid reason, e.g. census data may be out of date or unreliable / migration can change suddenly / birth rates may fall faster or slower than expected / countries define 'urban' or city boundaries differently / government policy can change / conflict, disasters or disease
Examples: Some countries have not held a census for many years (1) so the starting population used for the projection is only an estimate (1). Migration can change suddenly (1) for example because of conflict, a disaster or an economic crisis, so far more or fewer people arrive than expected (1). Birth rates may fall faster than expected (1) so natural increase, and the city's growth, is smaller than projected (1). Countries define urban areas and city boundaries in different ways (1) so a change in definition can change the figures even if no one moves (1). Accept any other appropriate response.
1 mark
Develops the reason, explaining how it makes the projection inaccurate
The development must explain the reason given in the first point. Do not credit 'nobody can predict the future' without a geographical reason.
Question 4
4 marks
Explain one advantage and one disadvantage of urban primacy for a country.
Model answer
One advantage is that investment can be concentrated in one large city, so the country can afford world-class infrastructure such as a container port and an international airport. This attracts TNCs and foreign investment, which creates jobs and boosts the national economy.
One disadvantage is that so many people migrate to the primate city that it cannot cope. Housing shortages lead to the growth of informal settlements, and traffic congestion becomes severe, while other regions of the country are left behind.
Explanation
Each half of the question earns 1 mark for identifying the advantage or disadvantage and 1 mark for developing it. Make the disadvantage a genuinely different point rather than the reverse of the advantage. Writing two advantages, or two disadvantages, can earn only 2 marks.
Mark scheme
1 mark
Identifies an advantage, e.g. investment and infrastructure are concentrated in one place / the primate city attracts TNCs and foreign investment / economies of scale / one major port or international airport serves the whole country
Examples (advantages): Investment can be concentrated in one large city (1) so it can afford world-class infrastructure such as an international airport and port, which attracts TNCs and boosts the national economy (1). A primate city has a large market and labour force (1) so businesses benefit from economies of scale and locate there, creating jobs (1). Accept any other appropriate response.
1 mark
Develops the advantage, explaining how it benefits the country
The development must explain the advantage given in the first point.
1 mark
Identifies a disadvantage, e.g. other regions are neglected / inequality between the primate city and the rest of the country / overcrowding and congestion in the primate city / over-dependence on one city
Examples (disadvantages): Investment is concentrated in the primate city (1) so other regions are neglected and regional inequality grows (1). So many people migrate to the primate city (1) that it suffers from housing shortages, informal settlements and traffic congestion (1). The whole country depends on one city (1) so a disaster or a strike there can disrupt the national economy (1). Accept any other appropriate response.
1 mark
Develops the disadvantage, explaining how it harms the country or its people
The development must explain the disadvantage given in the third point. Do not credit a disadvantage that is simply the opposite of the advantage (e.g. 'other cities get less investment' after 'the primate city gets more investment') unless it is developed with a new consequence.
Ready to try the rest? Every answer you write is marked against the mark scheme, so you can see exactly where the marks are.
Ctrl + Enter to check
Study HelperHints first, answers after you try
Stuck on this one? Ask for a hint and I’ll point you in the right direction, without giving the answer away. Once you’ve checked your answer, I’ll show you how the marks are awarded.