Level:
Correct: 0
Incorrect: 0
Marks: 0/0
Exam Practice
Course:
Topics:
Avg
score:
–
Topics
done:
0/20

Threats to tropical rainforests

Practise 28 exam-style questions on Threats to tropical rainforests for Edexcel GCSE Geography B (Paper 3). Write your answer as you would in the exam and get it marked in seconds against the mark scheme, point by point, with the Study Helper on hand if you get stuck.

  • 28 questions
  • 1–8 marks each
  • Instant marking
  • No sign-up needed
20 questions, marked as you go

Sample questions with model answers

Here are 4 of the questions in this topic, each with a model answer, an explanation of why it earns the marks and the mark scheme an examiner would use.

Question 1

1 mark

Study Figure 1, which shows the results of a survey of 40 households in a village close to an area of tropical rainforest in Central Africa. The survey was written for this course.

Calculate the percentage of the households that use a fuel made from wood (firewood or charcoal) as their main cooking fuel.
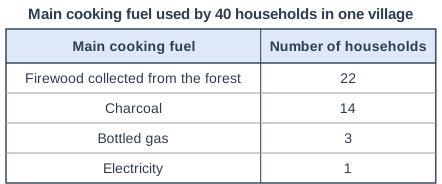
Main cooking fuel used by 40 households in one village. Table with columns "Main cooking fuel", "Number of households". Main cooking fuel: Firewood collected from the forest; Number of households: 22 | Main cooking fuel: Charcoal; Number of households: 14 | Main cooking fuel: Bottled gas; Number of households: 3 | Main cooking fuel: Electricity; Number of households: 1.

Model answer

22 + 14 = 36 households
36 ÷ 40 × 100 = 90%

Explanation

Add the households using firewood and charcoal, then divide by the total of 40 and multiply by 100. Charcoal is made from wood, so it must be included; leaving it out gives 55%.

Mark scheme
  1. 1 mark

    90% ((22 + 14) ÷ 40 × 100)

    Accept 90 or 90%. Correct answer with no working scores the mark. Do not credit 55% (firewood only) or 35% (charcoal only).
Question 2

2 marks

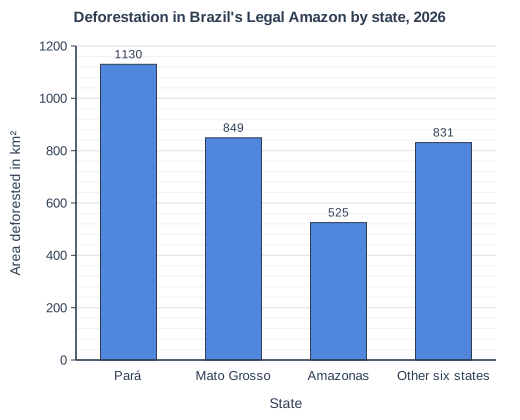
Study Figure 1, which shows the area of rainforest deforested in the nine states of Brazil's Legal Amazon in 2026 (August 2025 to July 2026). The data are the preliminary PRODES figures published on 16 October 2026 by Brazil's National Institute for Space Research (INPE); PRODES is INPE's satellite monitoring programme, and its final (consolidated) figures, published later, may differ slightly.

Calculate the percentage of the total area deforested in the Legal Amazon in 2026 that was in Pará.

Answer to one decimal place. Show your working.

Deforestation in Brazil's Legal Amazon by state, 2026. Bar chart of area deforested in km² for each state: Pará 1130, Mato Grosso 849, Amazonas 525, Other six states 831.

Model answer

Total = 1130 + 849 + 525 + 831 = 3335 km²
1130 ÷ 3335 × 100 = 33.88
Pará's share = 33.9%

Explanation

First add all four bars to find the total for the Legal Amazon (3335 km²), then divide Pará's value by it and multiply by 100. A common error is to leave out the 'other six states' bar, which gives 45.1%. About a third of all the clearing in 2026 was in this one state.

Mark scheme
  1. 1 mark

    Correct method: 1130 ÷ (1130 + 849 + 525 + 831) × 100, or 1130 ÷ 3335 × 100 (answer 33.9%)

    Accept 33.9 or 33.9%. Correct answer with no working scores both marks. Award this method mark for Pará's value divided by the total of all four bars (3335 km²) and multiplied by 100, even if the final answer is wrong or is not given to one decimal place.

  2. 1 mark

    33.9(%)

    Must be given to one decimal place: do not credit 34 or 33.88 for this mark. Do not credit 45.1 (dividing by 2504, the total without the other six states) or 295.1 (the total divided by Pará's value).

Question 3

2 marks

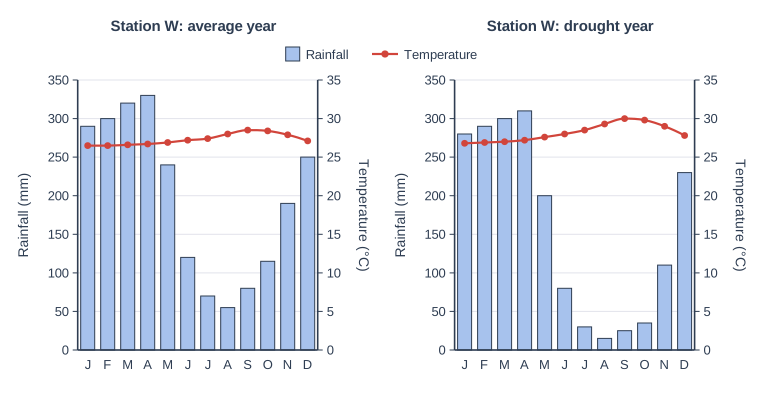
Study Figure 1, which shows climate graphs for Station W, an imaginary weather station in a tropical rainforest, in an average year and in a drought year. The data were written for this course.

Using evidence from Figure 1, suggest one reason why the risk of forest fires is greater in the drought year.

Two climate graphs side by side on the same scales: Station W: average year (left) and Station W: drought year (right). Each has blue bars for monthly rainfall, read on the left axis (Rainfall in mm, 0 to 350, numbered every 50), and a red line with a point for each month's mean temperature, read on the right axis (Temperature in °C, 0 to 35, numbered every 5). The months J F M A M J J A S O N D (January to December) run along the bottom; a key shows Rainfall (bars) and Temperature (line). Station W: average year: rainfall Jan 290, Feb 300, Mar 320, Apr 330, May 240, Jun 120, Jul 70, Aug 55, Sep 80, Oct 115, Nov 190, Dec 250 mm; temperature Jan 26.5, Feb 26.5, Mar 26.6, Apr 26.7, May 26.9, Jun 27.2, Jul 27.4, Aug 28, Sep 28.5, Oct 28.4, Nov 27.9, Dec 27.1 °C. Station W: drought year: rainfall Jan 280, Feb 290, Mar 300, Apr 310, May 200, Jun 80, Jul 30, Aug 15, Sep 25, Oct 35, Nov 110, Dec 230 mm; temperature Jan 26.8, Feb 26.9, Mar 27, Apr 27.2, May 27.6, Jun 28, Jul 28.5, Aug 29.3, Sep 30, Oct 29.8, Nov 29, Dec 27.8 °C.

Model answer

From July to October the drought year had only 105 mm of rain, compared with 320 mm in an average year. With so little rain, the leaf litter and dead wood on the forest floor dry out, so fires lit to clear nearby farmland can spread into the forest.

Explanation

The first mark is for evidence from the climate graphs (lower rainfall or higher temperatures in the dry season) and the second for explaining why this makes fire more likely. Rainforests are normally too damp to burn, so drought is what allows fires, usually started by people, to spread into them.

Mark scheme
  1. 1 mark

    A reason based on Figure 1, e.g. much less rain from July to October (105 mm against 320 mm) / four months under 50 mm / temperatures are higher, up to 30 °C in September

    Award 1 mark for a basic reason from Figure 1 and 1 mark for its development. Examples: From July to October the drought year had only 105 mm of rain compared with 320 mm in an average year (1) so leaf litter and dead wood on the forest floor dry out and can burn (1). Temperatures were higher, up to 30 °C in September (1) so more water evaporated and the vegetation became drier and easier to ignite (1). Four months had under 50 mm of rain (1) so the dry season was longer, giving fires lit to clear farmland more time to spread into the forest (1). Accept any other appropriate response. Readings within half a gridline (plus or minus 25 mm of rainfall or 2.5 °C) of the values given are acceptable, as are totals worked from such readings.

  2. 1 mark

    Develops the reason, e.g. litter and vegetation dry out and burn easily / fires set on farms spread into the forest

    Do not credit 'it is hot and dry' without evidence from Figure 1 or an explanation of why fires start or spread.

Question 4

4 marks

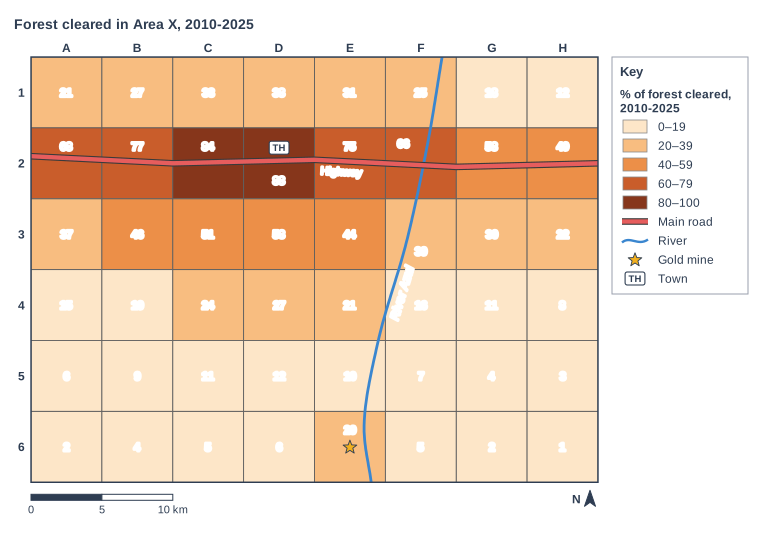
Study Figure 1, which shows the percentage of the forest cleared in each 5 km square of Area X between 2010 and 2025. The map was made with GIS from satellite images. Area X is an imaginary area of tropical rainforest, written for this course.

Using Figure 1 and your own knowledge, suggest two reasons why the percentage of forest cleared decreases with distance from the highway.

Forest cleared in Area X, 2010-2025. Map of a local area, 40 km from west to east and 30 km from south to north, with north at the top. Lines: the River Azul (a river, blue, named) runs from the north edge to the south edge, passing through the centre of the map; Highway (main road) runs from the west edge to the east edge, passing through the north of the map. Symbols: the gold mine in the south of the map (in square E6; 1.1 km from River Azul); the town in the north of the map (in square D2; beside Highway (main road)). Choropleth map of % of forest cleared, 2010-2025: squares are shaded in 5 classes, lighter for lower and darker for higher (key: 0–19 (the lightest orange-brown), 20–39 (light orange-brown), 40–59 (medium orange-brown), 60–79 (dark orange-brown), 80–100 (the darkest orange-brown)). The map is divided into 8 columns × 6 rows of squares, each 5 km by 5 km; columns A-H are lettered along the top (west to east) and rows 1-6 numbered down the side (north to south). Shading of each square (with the value printed in it): row 1: A1 20–39 (21), B1 20–39 (27), C1 20–39 (33), D1 20–39 (38), E1 20–39 (31), F1 20–39 (25), G1 0–19 (18), H1 0–19 (12); row 2: A2 60–79 (68), B2 60–79 (77), C2 80–100 (84), D2 80–100 (88), E2 60–79 (75), F2 60–79 (66), G2 40–59 (58), H2 40–59 (49); row 3: A3 20–39 (37), B3 40–59 (46), C3 40–59 (51), D3 40–59 (58), E3 40–59 (44), F3 20–39 (39), G3 20–39 (30), H3 20–39 (22); row 4: A4 0–19 (15), B4 0–19 (19), C4 20–39 (24), D4 20–39 (27), E4 20–39 (21), F4 0–19 (16), G4 0–19 (11), H4 0–19 (8); row 5: A5 0–19 (6), B5 0–19 (9), C5 0–19 (11), D5 0–19 (12), E5 0–19 (10), F5 0–19 (7), G5 0–19 (4), H5 0–19 (3); row 6: A6 0–19 (2), B6 0–19 (4), C6 0–19 (5), D6 0–19 (6), E6 20–39 (29), F6 0–19 (5), G6 0–19 (2), H6 0–19 (1). The key (beside the map) shows: [% of forest cleared, 2010-2025], 0–19, 20–39, 40–59, 60–79, 80–100, main road, river, gold mine, TH = town. Below the map: a scale bar marked 0, 5 and 10 km and a north arrow pointing to the top.

Model answer

Figure 1 shows that squares crossed by the highway have 49-88% of their forest cleared, while most squares in row 6, about 20 km from the highway, have under 10%. The highway gives easy access, so loggers and ranchers can move in and take timber and cattle to market cheaply; deep in the forest transport is slow and costly, so it is not worth clearing.

The highest value, 88% in D2, is next to the town. People in the town need land for farms and houses and wood for fuel, so the forest close to the town has been cleared most.

Explanation

Each reason needs evidence from the map (1) and an explanation of how access, transport costs or settlement causes the pattern (1). This distance-decay pattern is typical of satellite images of the Amazon, where clearing spreads out from roads. Answers that only describe the pattern, without explaining it, cannot reach full marks.

Mark scheme
  1. 1 mark

    First reason, linked to evidence from Figure 1, e.g. row 2 (on the highway) has values of 49-88% but row 6 is mostly under 10% / the highest value (88%) is beside the town on the highway

    Max 3 if no evidence from Figure 1 is used. A valid point made without evidence from Figure 1 can still be credited within this maximum. In each case, award 1 mark for a reason supported by evidence from Figure 1 and 1 mark for further explanation using own knowledge, up to 4 marks. The two reasons must be different. Examples: Squares on the highway have 49-88% cleared (1) because the road gives easy access, so loggers, ranchers and settlers can move in and take timber and cattle to market cheaply (1). Far from the highway, squares in row 6 are mostly under 10% cleared (1) because without roads it is too slow and costly to transport timber, cattle or crops, so the forest is left (1). The highest value, 88%, is in D2 next to the town (1) because people in the town clear nearby land for farms, housing and fuel wood (1). Land near the road is worth more (1) so it is cleared first, and clearing spreads outwards as new side tracks are cut (1). Remote areas are harder to reach for illegal clearing (1). Accept any other appropriate response.

  2. 1 mark

    Explains the first reason

  3. 1 mark

    Second reason, different from the first

    Do not credit 'it is easier to get to' twice in different words.

  4. 1 mark

    Explains the second reason

Ready to try the rest? Every answer you write is marked against the mark scheme, so you can see exactly where the marks are.

Study Helper Hints first, answers after you try

Stuck on this one? Ask for a hint and I’ll point you in the right direction, without giving the answer away. Once you’ve checked your answer, I’ll show you how the marks are awarded.