
Level:
Correct: 0
Incorrect: 0
Marks: 0/0
Exam Practice
Course:
Topics:
Avg
score:
–
Topics
done:
0/20

Access to energy and global patterns of energy use

Practise 26 exam-style questions on Access to energy and global patterns of energy use for Edexcel GCSE Geography B (Paper 3). Write your answer as you would in the exam and get it marked in seconds against the mark scheme, point by point, with the Study Helper on hand if you get stuck.

  • 26 questions
  • 1–8 marks each
  • Instant marking
  • No sign-up needed
20 questions, marked as you go

Sample questions with model answers

Here are 4 of the questions in this topic, each with a model answer, an explanation of why it earns the marks and the mark scheme an examiner would use.

Question 1

1 mark

Study Figure 1, which shows the percentage of people in each country who had access to electricity in 2024.

Source: World Bank, World Development Indicators (2026).

Identify the statement about Figure 1 that is correct.

Choose your answer.

  • A All the countries where under 25% of people had electricity are in Africa
  • B Every country in South America had under 75% of people with electricity
  • C Most countries in Asia had under 50% of people with electricity
  • D No country in Africa had 95% or more of people with electricity
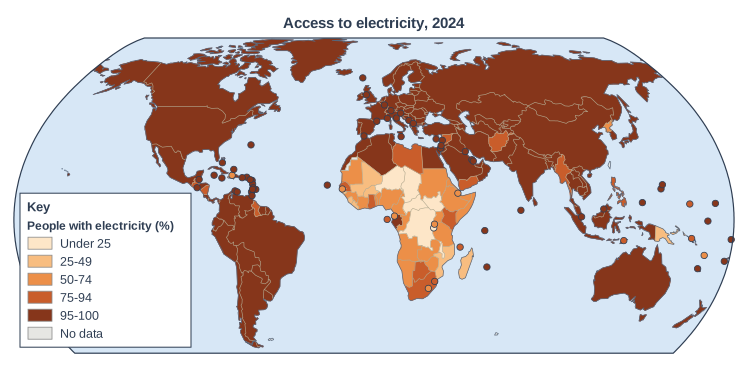
Map of the world, titled "Access to electricity, 2024". Countries are shaded in 5 classes (key heading "People with electricity (%)"): "Under 25" (lightest): 7 countries (7 in Africa); "25-49" (medium): 8 countries (7 in Africa, 1 in Oceania); "50-74" (medium): 26 countries (23 in Africa, 1 in North America, 1 in Asia, 1 in Oceania); "75-94" (medium): 20 countries (9 in Africa, 6 in Asia, 2 in North America, 2 in Oceania, 1 in South America); "95-100" (darkest): 148 countries (47 in Europe, 40 in Asia, 28 in North America, 14 in Oceania, 11 in South America, 8 in Africa). Other countries are grey, shown in the key as "No data". Burundi, Djibouti, Equatorial Guinea, Gambia, Haiti, Lesotho, Rwanda, Vanuatu, Comoros, Timor-Leste, Eswatini, Micronesia, São Tomé and Príncipe, Solomon Islands, Andorra, Antigua and Barbuda, Aruba, Bahamas, Bahrain, Barbados, Belize, Bermuda, British Virgin Islands, Brunei, Cabo Verde, Cayman Islands, Curaçao, Cyprus, Dominica, El Salvador, Faroe Islands, Fiji, French Polynesia, Gibraltar, Grenada, Guam, Isle of Man, Israel, Jamaica, Kiribati, Kuwait, Lebanon, Liechtenstein, Luxembourg, Maldives, Malta, Marshall Islands, Mauritius, Monaco, Montenegro, Nauru, New Caledonia, North Macedonia, Northern Mariana Islands, Palau, Palestine, Puerto Rico, Qatar, Saint Kitts and Nevis, Saint Lucia, Saint Vincent and the Grenadines, Samoa, San Marino, Seychelles, Singapore, Slovenia, Tonga, Trinidad and Tobago, Turks and Caicos Islands and Tuvalu are too small to see at this scale, so they are marked with a small shaded circle. The key (in a box on the map) shows: the heading "People with electricity (%)", "Under 25", "25-49", "50-74", "75-94", "95-100" and "No data".

Model answer

A

Explanation

All seven countries in the lowest class (under 25%), such as Chad, Niger and South Sudan, are in Africa. Most countries in Asia and South America are in the highest classes, and Egypt and other North African countries have almost universal access.

Mark scheme
  1. 1 mark

    A (All the countries where under 25% of people had electricity are in Africa)

    Accept the letter or the option written out; do not credit more than one answer. B is incorrect: most South American countries are in the 95-100% class. C is incorrect: most Asian countries are in the two highest classes (75-94% and 95-100%). D is incorrect: some African countries, such as Egypt, are in the 95-100% class. All other answers are incorrect.
Question 2

1 mark

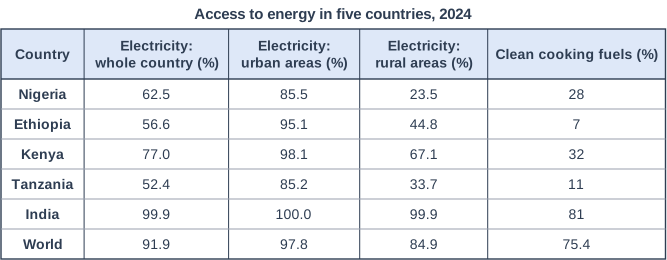
Study Figure 1, which shows access to electricity and to clean cooking fuels in five countries and the world in 2024.

Source: World Bank, World Development Indicators (2026). The urban and rural figures are estimates and can change sharply from one year to the next (rural Nigeria: 32.9% in 2023, 23.5% in 2024), so they should be used with care.

Identify the country in Figure 1 with the largest difference between urban and rural access to electricity.

Access to energy in five countries, 2024. Table with columns "Country", "Electricity: whole country (%)", "Electricity: urban areas (%)", "Electricity: rural areas (%)", "Clean cooking fuels (%)". Country: Nigeria; Electricity: whole country (%): 62.5; Electricity: urban areas (%): 85.5; Electricity: rural areas (%): 23.5; Clean cooking fuels (%): 28 | Country: Ethiopia; Electricity: whole country (%): 56.6; Electricity: urban areas (%): 95.1; Electricity: rural areas (%): 44.8; Clean cooking fuels (%): 7 | Country: Kenya; Electricity: whole country (%): 77.0; Electricity: urban areas (%): 98.1; Electricity: rural areas (%): 67.1; Clean cooking fuels (%): 32 | Country: Tanzania; Electricity: whole country (%): 52.4; Electricity: urban areas (%): 85.2; Electricity: rural areas (%): 33.7; Clean cooking fuels (%): 11 | Country: India; Electricity: whole country (%): 99.9; Electricity: urban areas (%): 100.0; Electricity: rural areas (%): 99.9; Clean cooking fuels (%): 81 | Country: World; Electricity: whole country (%): 91.9; Electricity: urban areas (%): 97.8; Electricity: rural areas (%): 84.9; Clean cooking fuels (%): 75.4.

Model answer

Nigeria

Explanation

Subtract the rural figure from the urban figure for each country: Nigeria's gap (62.0 percentage points) is the largest. A common error is to choose the country with the lowest rural figure without checking the urban figure.

Mark scheme
  1. 1 mark

    Nigeria (85.5 - 23.5 = 62.0 percentage points)

    All other answers are incorrect. The gaps are Nigeria 62.0, Tanzania 51.5, Ethiopia 50.3, Kenya 31.0 and India 0.1 percentage points.

Question 3

2 marks

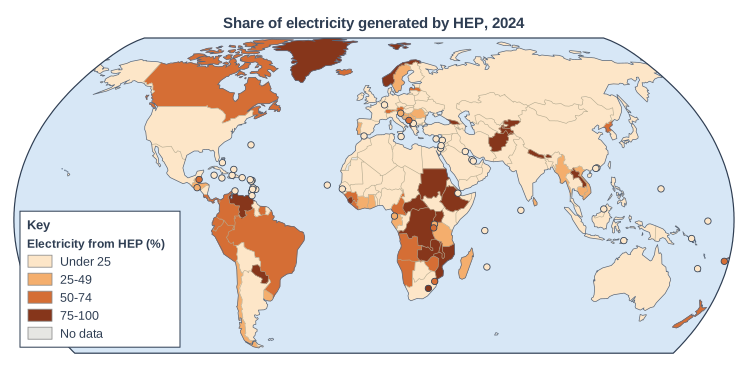
Study Figure 1, which shows the percentage of each country's electricity that was generated by HEP in 2024 (2022 or 2023 for a few countries).

Source: Ember and Energy Institute data, via Our World in Data (2026).

Using Figure 1 and your own knowledge, suggest one reason why countries in the Middle East, such as Saudi Arabia, generate little or no electricity from HEP.

Map of the world, titled "Share of electricity generated by HEP, 2024". Countries are shaded in 4 classes (key heading "Electricity from HEP (%)"): "Under 25" (lightest): 126 countries (37 in Asia, 27 in Africa, 27 in Europe, 21 in North America, 11 in Oceania, 3 in South America); "25-49" (medium): 24 countries (7 in Europe, 7 in Africa, 4 in Asia, 3 in North America, 2 in South America, 1 in Oceania); "50-74" (medium): 25 countries (8 in Africa, 5 in Europe, 5 in South America, 4 in North America, 2 in Oceania, 1 in Asia); "75-100" (darkest): 22 countries (10 in Africa, 7 in Asia, 2 in Europe, 2 in South America, 1 in North America). Other countries are grey, shown in the key as "No data". American Samoa, Antigua and Barbuda, Aruba, Bahamas, Bahrain, Barbados, Bermuda, Brunei, Cabo Verde, Cayman Islands, Cook Islands, Cyprus, Djibouti, Timor-Leste, Gambia, Gibraltar, Grenada, Guam, Haiti, Hong Kong, Israel, Jamaica, Kiribati, Kuwait, Lebanon, Luxembourg, Macao, Maldives, Malta, Mauritius, Montserrat, Nauru, New Caledonia, North Macedonia, Palestine, Puerto Rico, Qatar, Saint Kitts and Nevis, Saint Lucia, Saint Vincent and the Grenadines, Samoa, Seychelles, Solomon Islands, Tonga, Trinidad and Tobago, Turks and Caicos Islands, El Salvador, Equatorial Guinea, French Polynesia, Rwanda, Slovenia, Belize, Burundi, Eswatini, Fiji, Montenegro and Lesotho are too small to see at this scale, so they are marked with a small shaded circle. The key (in a box on the map) shows: the heading "Electricity from HEP (%)", "Under 25", "25-49", "50-74", "75-100" and "No data".

Model answer

The Middle East has a hot desert climate with very little rainfall, so there are few permanent rivers that could be dammed to generate HEP.

Explanation

The best answers link climate to rivers: no reliable rivers means no HEP. A human reason, such as plentiful cheap oil and gas, is also creditworthy if it is developed.

Mark scheme
  1. 1 mark

    Suggests a plausible reason, e.g. the hot desert climate has very little rainfall / there are few permanent rivers / large reserves of oil and gas

    Award 1 mark for a plausible reason and 1 mark for developing it. Examples: The climate is hot desert with very little rainfall (1), so there are few permanent rivers to dam (1). High temperatures mean that a lot of water would evaporate from reservoirs (1), so storing water for HEP would be wasteful (1). Countries such as Saudi Arabia have huge reserves of cheap oil and gas (1), so there is no need to build HEP stations (1). Accept any other appropriate response.

  2. 1 mark

    Develops the reason

Question 4

4 marks

Using your own knowledge, explain two ways in which demand for energy from different economic sectors affects a country's energy use per capita.

Model answer

Countries with a lot of heavy industry, such as steel works and chemical plants, have high energy use per person because these factories burn huge amounts of coal and gas and use a lot of electricity.

In contrast, in countries where most people work in subsistence farming, the work is done by hand or with animals, and few machines are used. This means very little commercial energy is used per person.

Explanation

Each way needs a sector (1) and an explanation of how it raises or lowers energy use per person (1). Using two different sectors, such as industry and farming, keeps the two ways clearly different.

Mark scheme
  1. 1 mark

    Identifies a first way, e.g. countries with large heavy industries (manufacturing) use more energy per person

    Award 1 mark for each way and 1 mark for explaining it, up to 2 marks for each way. Examples: Countries with a lot of heavy industry, such as steel, cement and chemicals (1), use huge amounts of coal, gas and electricity in their factories, so energy use per person is high (1). Where transport demand is high, for example high car ownership or long distances for lorries (1), large amounts of oil are used, raising energy use per person (1). In countries where most people work in subsistence farming (1), work is done by hand or with animals, so little commercial energy is used per person (1). A large service sector in a rich country (1) uses energy for offices, shops and IT, but often less than heavy industry, so energy use per person can fall as industry declines (1). Accept any other appropriate response.

  2. 1 mark

    Explains the first way

  3. 1 mark

    Identifies a second, different way, linked to a different sector

    The two ways must be about different sectors, e.g. industry and transport, or industry and farming.

  4. 1 mark

    Explains the second way

Ready to try the rest? Every answer you write is marked against the mark scheme, so you can see exactly where the marks are.

Study Helper Hints first, answers after you try

Stuck on this one? Ask for a hint and I’ll point you in the right direction, without giving the answer away. Once you’ve checked your answer, I’ll show you how the marks are awarded.