Level:
Correct: 0
Incorrect: 0
Marks: 0/0
Exam Practice
Course:
Topics:
Avg
score:
–
Topics
done:
0/20

Decision-making: battery minerals in boreal peatlands

Practise 25 exam-style questions on Decision-making: battery minerals in boreal peatlands for Edexcel GCSE Geography B (Paper 3). Write your answer as you would in the exam and get it marked in seconds against the mark scheme, point by point, with the Study Helper on hand if you get stuck.

  • 25 questions
  • 1–16 marks each
  • Instant marking
  • No sign-up needed
20 questions, marked as you go

Sample questions with model answers

Here are 4 of the questions in this topic, each with a model answer, an explanation of why it earns the marks and the mark scheme an examiner would use.

Question 1

1 mark

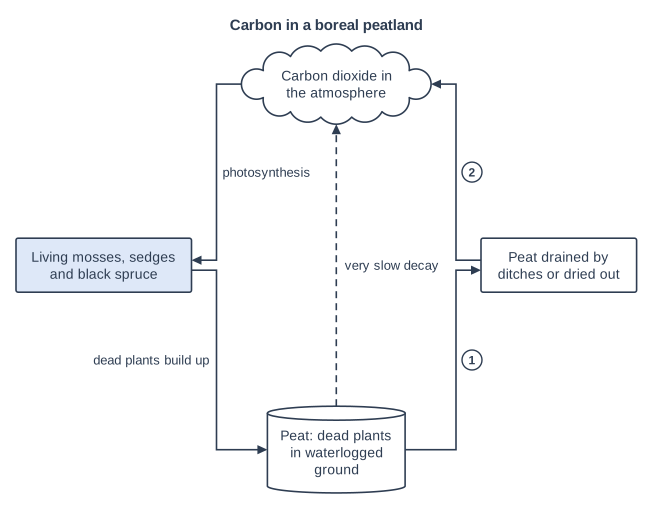
Figure 1 shows how carbon moves into and out of a boreal peatland, like those in the Hudson Bay Lowlands of northern Ontario, Canada (written for this course).

Identify the change that is most likely to happen at the arrow labelled 2.

Choose your answer.

  • A Faster decay of the peat, releasing carbon dioxide
  • B Photosynthesis by mosses, taking in carbon dioxide
  • C More dead plants building up as new peat
  • D Water evaporating from the surface of the bog
Carbon in a boreal peatland. Block diagram with four parts in five rows. Top row: a cloud "Carbon dioxide in the atmosphere". Third row, left to right: a box "Living mosses, sedges and black spruce" (shaded) and a box "Peat drained by ditches or dried out". Bottom row: a cylinder (database symbol) "Peat: dead plants in waterlogged ground". Connections (in step order): arrow 1: an arrow from "Peat: dead plants in waterlogged ground" to "Peat drained by ditches or dried out"; arrow 2: an arrow from "Peat drained by ditches or dried out" to "Carbon dioxide in the atmosphere"; an arrow from "Carbon dioxide in the atmosphere" to "Living mosses, sedges and black spruce", labelled "photosynthesis"; an arrow from "Living mosses, sedges and black spruce" to "Peat: dead plants in waterlogged ground", labelled "dead plants build up"; a dashed arrow from "Peat: dead plants in waterlogged ground" to "Carbon dioxide in the atmosphere", labelled "very slow decay".

Model answer

A

Explanation

Arrow 2 runs from the drained or dried-out peat back to the atmosphere. Once peat dries out, oxygen reaches it, so decomposers break it down much faster (and dry peat can also burn), releasing carbon dioxide. This is why damaged peat changes from a carbon store into a carbon source.

Mark scheme
  1. 1 mark

    A (Faster decay of the peat, releasing carbon dioxide)

    Accept the letter or the option written out; do not credit more than one answer. B is incorrect: photosynthesis is the flow from the atmosphere to the living plants. C is incorrect: dead plants building up is the flow from the plants into the peat. D is incorrect: the diagram shows flows of carbon, and evaporation is a flow of water.

Question 2

2 marks

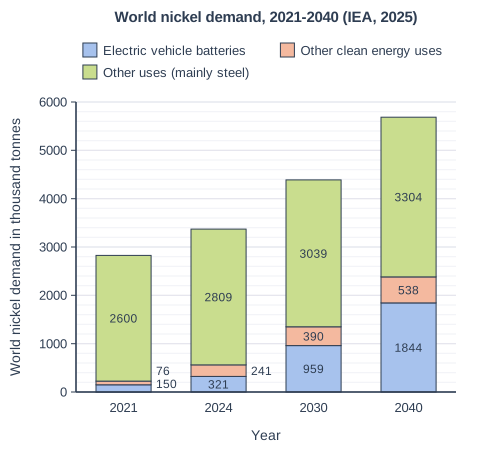
Figure 1 shows world demand for nickel in 2021 and 2024, and the demand expected in 2030 and 2040 if governments keep their present policies (written for this course using data from the International Energy Agency (IEA) Stated Policies Scenario, 2025). 'Other clean energy uses' include batteries that store electricity and equipment for renewable energy.

Calculate the percentage increase in nickel demand for electric vehicle batteries between 2024 and 2040.

Give your answer to one decimal place.

World nickel demand, 2021-2040 (IEA, 2025). Stacked bar chart with 4 vertical bars. The value axis (y-axis) is "World nickel demand in thousand tonnes", from 0 to 6000 marked every 1000; the bars are labelled along the x-axis, "Year", from left to right. Each bar is split into 3 parts, shown in the key: Electric vehicle batteries (bottom, blue), Other clean energy uses (middle, orange) and Other uses (mainly steel) (top, green). Values: 2021: electric vehicle batteries 150 thousand tonnes, other clean energy uses 76 thousand tonnes, other uses (mainly steel) 2600 thousand tonnes; 2024: electric vehicle batteries 321 thousand tonnes, other clean energy uses 241 thousand tonnes, other uses (mainly steel) 2809 thousand tonnes; 2030: electric vehicle batteries 959 thousand tonnes, other clean energy uses 390 thousand tonnes, other uses (mainly steel) 3039 thousand tonnes; 2040: electric vehicle batteries 1844 thousand tonnes, other clean energy uses 538 thousand tonnes, other uses (mainly steel) 3304 thousand tonnes. The value of each part is printed on it (just outside the bar, next to the part, where a part is too thin).

Model answer

(1844 - 321) ÷ 321 × 100 = 1523 ÷ 321 × 100 = 474.5%

Explanation

Percentage increase = (new value - old value) ÷ old value × 100, using 321 thousand tonnes for 2024 and 1844 thousand tonnes for 2040. Common errors are dividing by the 2040 value, forgetting to subtract (574.5) or not giving one decimal place.

Mark scheme
  1. 1 mark

    Method: (1844 - 321) ÷ 321 × 100 (= 1523 ÷ 321 × 100)

    Correct answer 474.5%. A correct answer with no working scores 2 marks. Award this mark for correct working even if the final answer is wrong. Accept any equivalent method, e.g. (1844 ÷ 321 - 1) × 100.

  2. 1 mark

    474.5 (%)

    Accept 474.5 or 474.5% only (one decimal place). Do not accept 474, 474.4 or 574.5 (1844 ÷ 321 × 100). Units are not required.

Question 3

4 marks

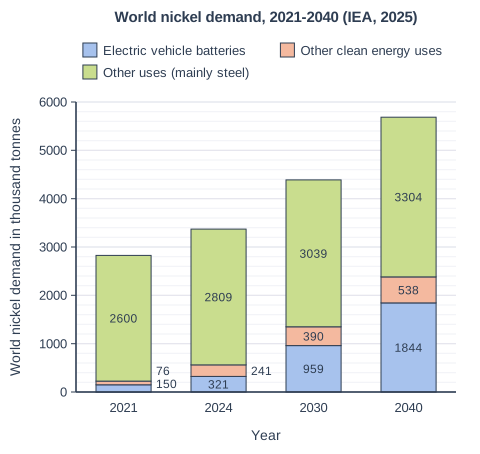
Figure 1 shows world demand for nickel in 2021 and 2024, and the demand expected in 2030 and 2040 if governments keep their present policies (written for this course using data from the International Energy Agency (IEA) Stated Policies Scenario, 2025). 'Other clean energy uses' include batteries that store electricity and equipment for renewable energy.

Using Figure 1 and your own knowledge, explain two reasons why world demand for nickel is expected to rise.

World nickel demand, 2021-2040 (IEA, 2025). Stacked bar chart with 4 vertical bars. The value axis (y-axis) is "World nickel demand in thousand tonnes", from 0 to 6000 marked every 1000; the bars are labelled along the x-axis, "Year", from left to right. Each bar is split into 3 parts, shown in the key: Electric vehicle batteries (bottom, blue), Other clean energy uses (middle, orange) and Other uses (mainly steel) (top, green). Values: 2021: electric vehicle batteries 150 thousand tonnes, other clean energy uses 76 thousand tonnes, other uses (mainly steel) 2600 thousand tonnes; 2024: electric vehicle batteries 321 thousand tonnes, other clean energy uses 241 thousand tonnes, other uses (mainly steel) 2809 thousand tonnes; 2030: electric vehicle batteries 959 thousand tonnes, other clean energy uses 390 thousand tonnes, other uses (mainly steel) 3039 thousand tonnes; 2040: electric vehicle batteries 1844 thousand tonnes, other clean energy uses 538 thousand tonnes, other uses (mainly steel) 3304 thousand tonnes. The value of each part is printed on it (just outside the bar, next to the part, where a part is too thin).

Model answer

First, nickel demand for electric vehicle batteries is expected to rise from 321 thousand tonnes in 2024 to 1,844 thousand tonnes in 2040. This is because many governments are encouraging people to switch to electric cars to cut the carbon dioxide emitted by petrol and diesel vehicles.

Second, other uses, mainly stainless steel, are still expected to grow from 2,809 to 3,304 thousand tonnes. As populations and incomes rise in emerging countries such as China and India, more buildings, machines and household goods are made using stainless steel.

Explanation

Each reason earns 1 mark for evidence from Figure 1 and 1 for explaining it with own knowledge, for example climate policies driving electric vehicles or rising affluence driving steel use. Two points about electric cars count as one reason, and answers with no evidence from Figure 1 can reach only 3 marks.

Mark scheme
  1. 1 mark

    Identifies a first reason with evidence from Figure 1, e.g. demand for EV batteries rises from 321 to 1844 thousand tonnes / other clean energy uses rise (241 to 538) / other uses, mainly steel, rise (2809 to 3304)

    Max 3 if no evidence from Figure 1 is used. Examples: Demand for EV batteries rises from 321 to 1844 thousand tonnes (1) because governments are encouraging electric cars to cut carbon emissions from petrol and diesel vehicles (1). Other clean energy uses grow from 241 to 538 thousand tonnes (1) because more renewable electricity needs batteries to store power for when the wind does not blow (1). Steel and other uses still grow, to 3304 thousand tonnes (1) because growing, wealthier populations in emerging countries build more and buy more goods made with stainless steel (1). Accept any other appropriate response.

  2. 1 mark

    Explains the first reason using own knowledge

    The explanation should say why that use is growing (e.g. climate policies, renewable energy, rising affluence, urbanisation).

  3. 1 mark

    Identifies a second, different reason with evidence from Figure 1

    The two reasons must be different; two points about EV batteries count once.

  4. 1 mark

    Explains the second reason using own knowledge

Question 4

8 marks

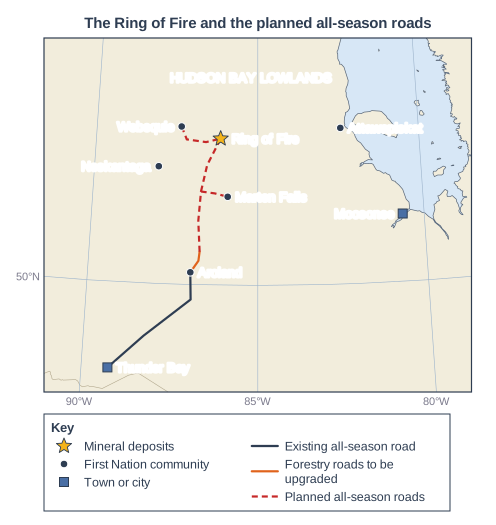
Figure 1 is a map of part of northern Ontario, Canada. It shows the Ring of Fire mineral deposits, some First Nation communities and the planned all-season roads (routes simplified; written for this course using information from the Ontario government, 2025-2026).

Figure 2: First Nations and the planned roads (written for this course using information from news reports, 2024-2026; the two views are invented)
- Webequie and Marten Falls First Nations are leading the planning of the roads and have signed economic partnership agreements with the Ontario government. Aroland First Nation is a third partner.
- The planned roads would link Webequie and Marten Falls to Ontario's highways. Neskantaga and Attawapiskat would not be on the roads (Figure 1).
- Neskantaga and Attawapiskat First Nations oppose the roads. They say they were not properly consulted and fear for their way of life. They have built a settlement where a road would cross the Attawapiskat River, which flows to Attawapiskat and James Bay, and plan to block the road.
- The average winter-road season for remote First Nations in Ontario has fallen from 77 days to as few as 28 days (2024).
- View A, a councillor from a First Nation that is a partner in the roads: 'Food, fuel and building materials are flown in or come on a winter road that now opens for only a few weeks. A road would cut prices and bring jobs and a share in the businesses. But we want our own environmental review and a real say.'
- View B, a hunter from a First Nation downstream of the planned roads: 'The road crosses the rivers and the muskeg where our families hunt caribou and geese and catch fish. If the water is polluted, it flows down to us. We were not properly asked.'

Using evidence from Figures 1 and 2 and your own knowledge, assess the reasons why First Nations near the Ring of Fire do not all agree about the planned roads.

Map of the area from 91°W to 79°W and from 48°N to 54.5°N, titled "The Ring of Fire and the planned all-season roads". Lines of latitude and longitude are drawn every 5°, with their values (°N/°S and °E/°W) printed round the edge. Points: a yellow star labelled "Ring of Fire" in Canada; a dot labelled "Webequie" in Canada; a dot labelled "Marten Falls" in Canada; a dot labelled "Neskantaga" in Canada; a dot labelled "Attawapiskat" in Canada; a dot labelled "Aroland" in Canada; a blue square labelled "Thunder Bay" in Canada; a blue square labelled "Moosonee" on the coast of Canada; the words "HUDSON BAY LOWLANDS" printed on the map in Canada. Lines drawn: a line from Canada to Canada, heading generally north-east (key: "Existing all-season road"); a line from Canada to Canada, heading generally north-east (key: "Forestry roads to be upgraded"); a dashed line from Canada to Canada, heading generally north-east (key: "Planned all-season roads"); a dashed line from Canada to Canada, heading generally north; a dashed line from Canada to Canada, heading generally east. The key (below the map) shows: "Mineral deposits", "First Nation community", "Town or city", "Existing all-season road", "Forestry roads to be upgraded" and "Planned all-season roads".

Model answer

The First Nations near the Ring of Fire disagree for several linked reasons, but the most important is that the benefits and the risks of the roads would not be shared equally.

Location explains much of the difference. Figure 1 shows that Webequie and Marten Falls are at the ends of the planned roads, so they would gain an all-season link to Ontario's highways. View A explains why this matters: food, fuel and building materials are flown in or brought on a winter road that now opens for only a few weeks, and Figure 2 shows the average season has fallen from 77 to as few as 28 days. A road would cut prices and bring jobs and shares in businesses, so these communities are partners. By contrast, Neskantaga is not on a planned road and Attawapiskat lies far downstream near James Bay. These communities would get few of the benefits but could suffer the costs, as View B says: if the rivers are polluted, the water flows down to them.

A second reason is consultation. Neskantaga and Attawapiskat say they were not properly asked, while Webequie and Marten Falls are leading the planning and have signed agreements. People are more likely to accept a project when they help to control it. This is shown by the settlement that the opponents have built at the river crossing.

The views are not completely opposed, however. Even View A wants the community's own environmental review and a real say, which shows that partner communities also care about the land, water and wildlife. Both sides value hunting, fishing and their way of life; they differ in how far they trust that the risks can be controlled and in who gets to decide.

Overall, the main reason is the uneven sharing of benefits and risks, which depends on where each community is. Differences in consultation make this worse, because communities that carry the risks without being involved are the most likely to oppose the roads.

Explanation

Level 3 answers use the map and both views to explain several reasons (location, benefits, risks downstream, consultation, values) and judge which matters most. Answers that only retell the two views, or treat the communities as simply for or against, are unbalanced and stay in Level 1 or 2.

Mark scheme
  1. 8 marks

    Levels of response (8 marks).
    Level 3 (7-8 marks): Applies understanding to deconstruct information and provide logical connections between concepts throughout. A balanced, well-developed argument that synthesises relevant understanding coherently, leading to judgements that are supported by evidence throughout. (AO3) Uses geographical skills to obtain accurate information that supports all aspects of the argument. (AO4)
    Level 2 (4-6 marks): Applies understanding to deconstruct information and provide some logical connections between concepts. An imbalanced argument that synthesises mostly relevant understanding but not entirely coherently, leading to judgements that are supported by evidence occasionally. (AO3) Uses geographical skills to obtain accurate information that supports some aspects of the argument. (AO4)
    Level 1 (1-3 marks): Attempts to apply understanding to deconstruct information but understanding and connections are flawed. An unbalanced or incomplete argument that provides limited synthesis of understanding. Judgements are supported by limited evidence. (AO3) Uses some geographical skills to obtain information with limited relevance and accuracy, which supports few aspects of the argument. (AO4)
    0 marks: No acceptable response.

    AO3 (4 marks) / AO4 (4 marks). Answers should address the reasons for the different views. The assessment may offer a view on which reason matters most. Indicative content (not a checklist; credit other valid points):
    AO4 (use of evidence from Figures 1 and 2): Webequie and Marten Falls are at the ends of planned roads, so the roads would connect them; Neskantaga is not on a planned road; Attawapiskat is far downstream on the Attawapiskat River near James Bay and is not linked; Webequie and Marten Falls lead the projects and have partnership agreements (Aroland is a partner); Neskantaga and Attawapiskat say they were not properly consulted, fear for their way of life and plan to block the road at the river crossing; the winter-road season has fallen from 77 to as few as 28 days; View A stresses cheaper goods, jobs and shares but wants its own environmental review; View B stresses hunting, fishing and pollution flowing downstream.
    AO3 (assessment): judgement that location is a key reason: communities at the ends of the roads gain year-round access and business opportunities, while communities that are not connected or are downstream would carry risks (pollution, more outsiders on the land) with few benefits; judgement that consultation and control matter as much as the road itself: partner communities have a say in the plans, while opponents feel excluded; judgement that the views overlap: even the partner wants its own environmental review, so the disagreement is partly about who decides and how, not simply support against opposition; judgement that the shrinking winter-road season makes better access urgent for everyone, but communities weigh this need against risks to land, water and food differently; judgement that differences in values and priorities (economic opportunity, protecting a land-based way of life) are linked to the above rather than separate; an overall view, e.g. the most important reason is the uneven sharing of benefits and risks between communities, which depends on where they are and whether they have been involved.

Ready to try the rest? Every answer you write is marked against the mark scheme, so you can see exactly where the marks are.

Study Helper Hints first, answers after you try

Stuck on this one? Ask for a hint and I’ll point you in the right direction, without giving the answer away. Once you’ve checked your answer, I’ll show you how the marks are awarded.