Level:
Correct: 0
Incorrect: 0
Marks: 0/0
Exam Practice
Course:
Topics:
Avg
score:
–
Topics
done:
0/20

Protecting and managing tropical rainforests

Practise 27 exam-style questions on Protecting and managing tropical rainforests for Edexcel GCSE Geography B (Paper 3). Write your answer as you would in the exam and get it marked in seconds against the mark scheme, point by point, with the Study Helper on hand if you get stuck.

  • 27 questions
  • 1–8 marks each
  • Instant marking
  • No sign-up needed
20 questions, marked as you go

Sample questions with model answers

Here are 4 of the questions in this topic, each with a model answer, an explanation of why it earns the marks and the mark scheme an examiner would use.

Question 1

1 mark

Study Figure 1, which shows the change in the loss of tropical primary forest between 2024 and 2025 in seven countries (World Resources Institute, Global Forest Review, 2026).

Identify the statement that is supported by Figure 1.

Choose your answer.

  • A Forest loss fell in every South American country shown
  • B Forest loss rose in every African country shown
  • C Forest loss fell in every Asian country shown
  • D Forest loss fell by more than 25% in every country shown
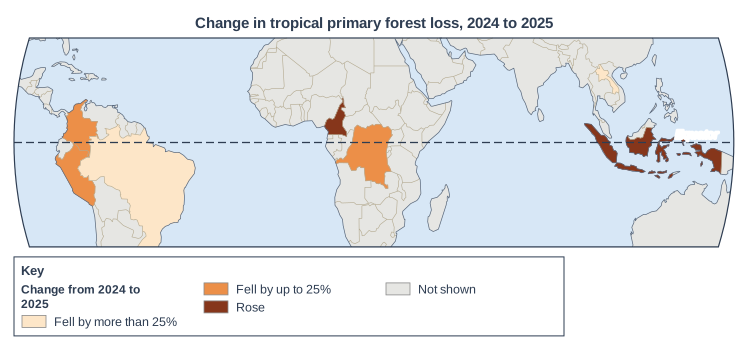
Map of the area from 95°W to 145°E and from 30°S to 30°N, titled "Change in tropical primary forest loss, 2024 to 2025". Lines of latitude: the Equator (0°), drawn dashed and labelled "Equator". Countries are shaded in 3 classes (key heading "Change from 2024 to 2025"): "Fell by more than 25%" (lightest): 2 countries (1 in South America, 1 in Asia); "Fell by up to 25%" (medium): 3 countries (2 in South America, 1 in Africa); "Rose" (darkest): 2 countries (1 in Asia, 1 in Africa). Other countries are grey, shown in the key as "Not shown". The key (below the map) shows: the heading "Change from 2024 to 2025", "Fell by more than 25%", "Fell by up to 25%", "Rose" and "Not shown".

Model answer

A

Explanation

Check each statement against the shading of every country on the continent named. Only statement A fits: all three South American countries shown are shaded in the two 'fell' classes. Statement B fails because loss fell in the DR Congo, and statement C fails because loss rose in Indonesia.

Mark scheme
  1. 1 mark

    A (Forest loss fell in every South American country shown)

    Accept the letter or the option written out; do not credit more than one answer. All other answers are incorrect. Brazil (fell by more than 25%), Colombia and Peru (fell by up to 25%) are the South American countries shown. B is incorrect: the DR Congo is in Africa and its loss fell. C is incorrect: Indonesia is in Asia and its loss rose. D is incorrect: loss fell by up to 25% in Colombia, Peru and the DR Congo, and rose in Indonesia and Cameroon.
Question 2

2 marks

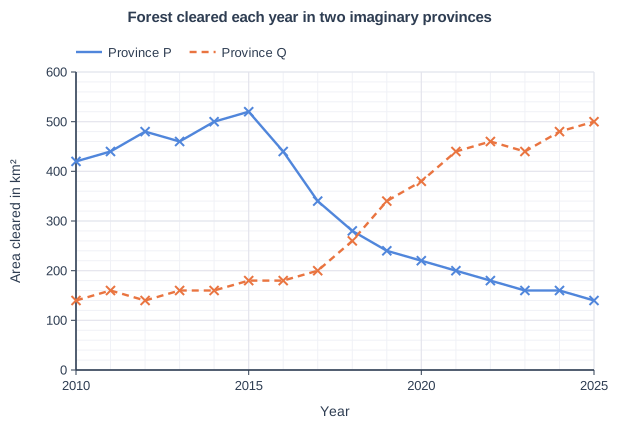
Study Figure 1, which shows how much rainforest was lost to clearing every year from 2010 to 2025 in two imaginary provinces of the same rainforest country (data written for this course). In Province P, satellite monitoring of clearing began in 2016 and large areas of forest were handed to Indigenous and local communities to manage. In Province Q, a new paved highway opened in 2018 and cattle ranches spread along it.

Calculate the percentage change in the area cleared each year in Province P between 2015 and 2025.

Answer to one decimal place. Show your working.

Forest cleared each year in two imaginary provinces. Line graph of area cleared in km² (y-axis, 0 to 600) against year (x-axis, 2010 to 2025). "Province P" joins the points (2010, 420), (2011, 440), (2012, 480), (2013, 460), (2014, 500), (2015, 520), (2016, 440), (2017, 340), (2018, 280), (2019, 240), (2020, 220), (2021, 200), (2022, 180), (2023, 160), (2024, 160), (2025, 140). "Province Q" (dashed) joins the points (2010, 140), (2011, 160), (2012, 140), (2013, 160), (2014, 160), (2015, 180), (2016, 180), (2017, 200), (2018, 260), (2019, 340), (2020, 380), (2021, 440), (2022, 460), (2023, 440), (2024, 480), (2025, 500).

Model answer

2015: 520 km²; 2025: 140 km²
Change = 140 - 520 = -380 km²
-380 ÷ 520 × 100 = -73.08
Percentage change = -73.1% (a fall of 73.1%)

Explanation

Percentage change is (new value - old value) ÷ old value × 100, so the difference must be divided by the 2015 value. A correct answer gains both marks even without working; correct working with a slip gains 1 mark. Dividing by the 2025 value, or reading Province Q's line instead of Province P's, are the common errors.

Mark scheme
  1. 1 mark

    Method: (140 - 520) ÷ 520 × 100, or 380 ÷ 520 × 100

    Correct answer with no working scores full marks (2 marks). Award 1 mark for a correct method using readings within the accepted ranges (510 to 530 km² for 2015 and 130 to 150 km² for 2025) when the final answer is wrong (for example an arithmetic slip) or not given to one decimal place. Do not credit dividing by the 2025 value (380 ÷ 140 × 100 = 271.4).

  2. 1 mark

    -73.1% (a fall / decrease of 73.1%)

    Accept 73.1 with or without the % sign, and with or without the minus sign provided the answer does not call it an increase. Must be given to one decimal place: do not credit 73 or 73.08 for this mark. Accept readings from 510 to 530 km² (2015) and from 130 to 150 km² (2025), half a gridline either side of the plotted values. Award this mark for the answer worked correctly, to one decimal place, from the student's own readings within these ranges: answers from 70.6% to 75.5% (as a fall), e.g. 73.1% from 520 and 140. Do not credit 380 (the difference only).

Question 3

2 marks

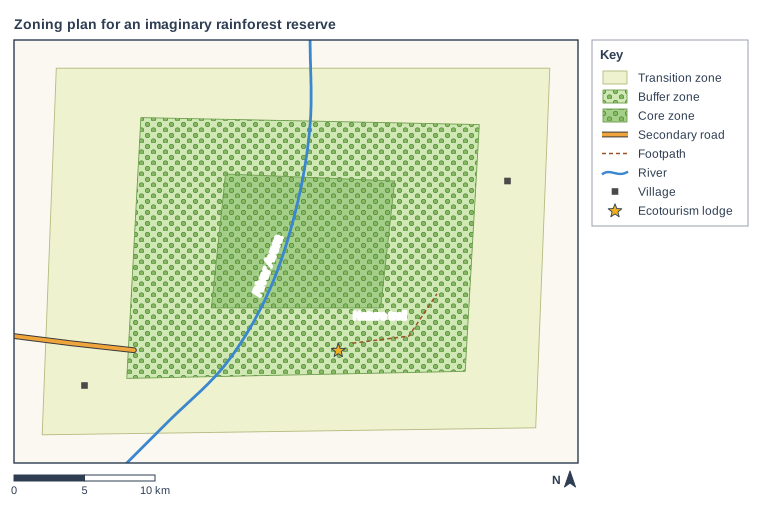
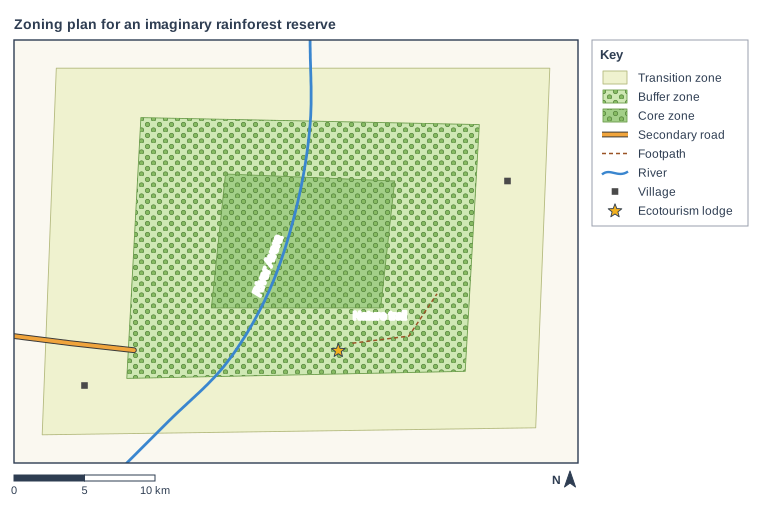
Study Figure 1, which shows a zoning plan for an imaginary rainforest reserve (written for this course). In the core zone no logging, farming or settlement is allowed. In the buffer zone only low-impact activities are allowed, such as ecotourism, research and collecting nuts and fruit. The transition zone contains villages and farms.

Using Figure 1 and your own knowledge, suggest one reason why the plan surrounds the core zone with a buffer zone.

Zoning plan for an imaginary rainforest reserve. Map of a local area, 40 km from west to east and 30 km from south to north, with north at the top. Areas: the transition zone shown pale yellow-green, in the centre of the map; the buffer zone shown green with tree symbols, in the centre of the map; the core zone shown dark green with tree symbols, in the centre of the map. Lines: the River Avera (a river, blue, named) runs from the north edge to the south edge, passing through the centre of the map; a secondary road runs from the west edge to the south-west of the map; Nature trail (footpath) runs from the south of the map to the east of the map, passing through the south-east of the map. Symbols: 2 village symbols in the south-west and east of the map; the ecotourism lodge in the south of the map (inside the transition zone and the buffer zone; beside Nature trail (footpath)). The key (beside the map) shows: transition zone, buffer zone, core zone, secondary road, footpath, river, village, ecotourism lodge. Below the map: a scale bar marked 0, 5 and 10 km and a north arrow pointing to the top.

Model answer

The buffer zone keeps the villages, farms and road in the transition zone several kilometres away from the core zone. This means fires lit to clear farmland, hunting and other disturbance are less likely to reach the core, so its wildlife is left undisturbed.

Explanation

One mark is for a reason and one for explaining how the buffer zone protects the core. The map helps: the farms, villages and road are all outside the buffer zone. Simply repeating that the buffer zone 'protects the core' earns no credit without saying how.

Mark scheme
  1. 1 mark

    Suggests a reason, e.g. it keeps farms, villages and roads away from the core zone / it separates the core zone from the transition zone / it reduces disturbance or edge effects at the edge of the core / it gives local people a place to use the forest lightly

    Allow 1 mark for a basic suggestion based on Figure 1 or own knowledge and 1 mark for its development. Examples: The buffer zone keeps the villages, farms and road of the transition zone several kilometres from the core zone (1) so fires lit to clear farmland, hunting and noise are less likely to reach the most protected forest (1). Forest at the edge of a clearing is drier, windier and easier for people to enter (1) so a ring of forest around the core keeps its centre undisturbed for wildlife (1). Allowing low-impact uses such as nut collecting in the buffer zone (1) means local people can meet their needs there, so they have less reason to enter the core zone (1). Accept any other appropriate response.

  2. 1 mark

    Develops the reason, explaining how it protects the core zone

    Only one reason can be credited. Do not credit 'to protect the core zone' with no explanation of how.

Question 4

4 marks

Study Figure 1, which shows a zoning plan for an imaginary rainforest reserve (written for this course). In the core zone no logging, farming or settlement is allowed. In the buffer zone only low-impact activities are allowed, such as ecotourism, research and collecting nuts and fruit. The transition zone contains villages and farms.

Using Figure 1, suggest two ways in which this zoning plan could allow local people to earn a living without damaging the core zone.

Zoning plan for an imaginary rainforest reserve. Map of a local area, 40 km from west to east and 30 km from south to north, with north at the top. Areas: the transition zone shown pale yellow-green, in the centre of the map; the buffer zone shown green with tree symbols, in the centre of the map; the core zone shown dark green with tree symbols, in the centre of the map. Lines: the River Avera (a river, blue, named) runs from the north edge to the south edge, passing through the centre of the map; a secondary road runs from the west edge to the south-west of the map; Nature trail (footpath) runs from the south of the map to the east of the map, passing through the south-east of the map. Symbols: 2 village symbols in the south-west and east of the map; the ecotourism lodge in the south of the map (inside the transition zone and the buffer zone; beside Nature trail (footpath)). The key (beside the map) shows: transition zone, buffer zone, core zone, secondary road, footpath, river, village, ecotourism lodge. Below the map: a scale bar marked 0, 5 and 10 km and a north arrow pointing to the top.

Model answer

First, the ecotourism lodge and the nature trail are in the buffer zone. Local people can work there as guides, cooks or cleaners, earning money from visitors who come to see the wildlife of the protected core zone, so they have a reason to keep it undamaged.

Second, the transition zone contains villages and farms beside the road. Families can farm there and use the road to take their crops to market, so they do not need to clear land inside the core zone.

Explanation

Each way should be taken from the map (the lodge, the trail, the farms and villages, or nut collecting in the buffer zone) and developed by explaining how it provides income without harming the core zone. Two jobs at the same lodge count as one way.

Mark scheme
  1. 1 mark

    Suggests a first way based on Figure 1, e.g. jobs at the ecotourism lodge or as guides on the nature trail in the buffer zone / collecting nuts and fruit in the buffer zone / farming in the transition zone near the villages and road / jobs in research or as rangers in the buffer zone

    Allow 1 mark for each way based on Figure 1, which can then be developed for a second mark. Examples: The ecotourism lodge and nature trail are in the buffer zone (1) so local people can work as guides or cooks, earning money from visitors who come to see wildlife that lives in the protected core zone (1). Collecting nuts and fruit is allowed in the buffer zone (1) so families can sell forest products without cutting down trees (1). Farms are allowed in the transition zone near the villages and the road (1) so farmers can grow and sell crops without needing to clear land in the core zone (1). Accept any other appropriate response based on Figure 1.

  2. 1 mark

    Develops the first way

  3. 1 mark

    Suggests a second, different way based on Figure 1

    The two ways must be different (e.g. not two different jobs at the lodge).

  4. 1 mark

    Develops the second way

Ready to try the rest? Every answer you write is marked against the mark scheme, so you can see exactly where the marks are.

Study Helper Hints first, answers after you try

Stuck on this one? Ask for a hint and I’ll point you in the right direction, without giving the answer away. Once you’ve checked your answer, I’ll show you how the marks are awarded.