
Level:
Correct: 0
Incorrect: 0
Marks: 0/0
Exam Practice
Course:
Topics:
Avg
score:
–
Topics
done:
0/20

Rising demand for resources: Malthus and Boserup

Practise 26 exam-style questions on Rising demand for resources: Malthus and Boserup for Edexcel GCSE Geography B (Paper 3). Write your answer as you would in the exam and get it marked in seconds against the mark scheme, point by point, with the Study Helper on hand if you get stuck.

  • 26 questions
  • 1–8 marks each
  • Instant marking
  • No sign-up needed
20 questions, marked as you go

Sample questions with model answers

Here are 4 of the questions in this topic, each with a model answer, an explanation of why it earns the marks and the mark scheme an examiner would use.

Question 1

1 mark

Study Figure 1, which shows world population estimates and the United Nations' 2024 projections of future world population.

Calculate the difference between the high projection and the low projection for 2100.
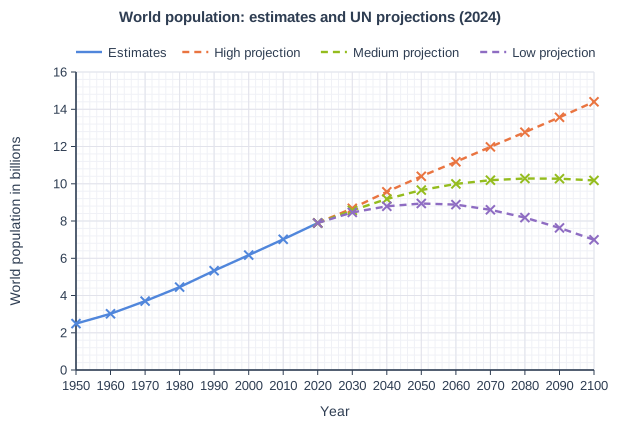
World population: estimates and UN projections (2024). Line graph of world population in billions (y-axis, 0 to 16) against year (x-axis, 1950 to 2100). "Estimates" joins the points (1950, 2.49), (1960, 3.02), (1970, 3.7), (1980, 4.45), (1990, 5.33), (2000, 6.17), (2010, 7.02), (2020, 7.89). "High projection" (dashed) joins the points (2020, 7.89), (2030, 8.68), (2040, 9.57), (2050, 10.4), (2060, 11.18), (2070, 11.98), (2080, 12.77), (2090, 13.57), (2100, 14.4). "Medium projection" (dashed) joins the points (2020, 7.89), (2030, 8.57), (2040, 9.18), (2050, 9.66), (2060, 9.99), (2070, 10.19), (2080, 10.28), (2090, 10.27), (2100, 10.18). "Low projection" (dashed) joins the points (2020, 7.89), (2030, 8.46), (2040, 8.79), (2050, 8.94), (2060, 8.88), (2070, 8.6), (2080, 8.18), (2090, 7.63), (2100, 6.99).

Model answer

14.4 - 7.0 = 7.4 billion (exact data: 14.40 - 6.99 = 7.41 billion)

Explanation

The difference is the high projection minus the low projection for the same year. A gap of over 7 billion people by 2100 shows how uncertain long-term projections are. Read both values carefully against the scale, where each small square is 0.4 billion.

Mark scheme
  1. 1 mark

    7.41 billion (14.40 - 6.99); accept any answer from 7.0 to 7.8 billion

    Readings from the graph of about 14.4 billion (high) and about 7.0 billion (low) are expected; readings within about 0.2 billion either side are acceptable, giving answers from 7.0 to 7.8. Accept with or without units; also accept the answer in millions (e.g. 7,410 million). Correct answer with no working scores full marks. Do not accept 21.4 (adding the values).
Question 2

1 mark

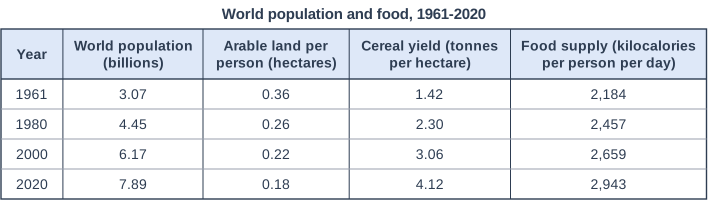
Study Figure 1, which shows world population and food data from 1961 to 2020. Data: UN World Population Prospects 2024, the World Bank (World Development Indicators, October 2026 update) and the FAO (FAOSTAT food balances, 2025 release).

Calculate the percentage decrease in arable land per person between 1961 and 2020.

World population and food, 1961-2020. Table with columns "Year", "World population (billions)", "Arable land per person (hectares)", "Cereal yield (tonnes per hectare)", "Food supply (kilocalories per person per day)". Year: 1961; World population (billions): 3.07; Arable land per person (hectares): 0.36; Cereal yield (tonnes per hectare): 1.42; Food supply (kilocalories per person per day): 2,184 | Year: 1980; World population (billions): 4.45; Arable land per person (hectares): 0.26; Cereal yield (tonnes per hectare): 2.30; Food supply (kilocalories per person per day): 2,457 | Year: 2000; World population (billions): 6.17; Arable land per person (hectares): 0.22; Cereal yield (tonnes per hectare): 3.06; Food supply (kilocalories per person per day): 2,659 | Year: 2020; World population (billions): 7.89; Arable land per person (hectares): 0.18; Cereal yield (tonnes per hectare): 4.12; Food supply (kilocalories per person per day): 2,943.

Model answer

(0.36 - 0.18) ÷ 0.36 × 100 = 50%

Explanation

Percentage decrease = (original value - new value) ÷ original value × 100. Arable land per person halved between 1961 and 2020 because the population grew much faster than the area of farmland.

Mark scheme
  1. 1 mark

    50% ((0.36 - 0.18) ÷ 0.36 × 100)

    Accept 50 or 50% (also accept -50%). Correct answer with no working scores full marks. Do not accept 0.18 (the difference) or 100% (dividing by 0.18).

Question 3

2 marks

Using your own knowledge, explain one way in which farmers may respond to a growing population, according to Boserup's theory.

Model answer

Farmers may build irrigation channels to bring water to their fields. This allows crops to be grown in the dry season as well as the wet season, so the same land can produce two or more harvests a year and feed more people.

Explanation

Boserup argued that population pressure drives agricultural intensification. One mark is for a specific change in farming and one for explaining how it increases output. Vague answers such as 'they find new ideas' need a concrete example.

Mark scheme
  1. 1 mark

    Identifies a way farmers intensify, e.g. shorter fallow periods / irrigation / terracing / using fertiliser or manure / new tools or machinery / new crop varieties

    Examples: Farmers shorten the fallow period, using land more often (1), so more crops are grown from the same area of land (1). They build irrigation channels (1), so crops can be grown in the dry season and land can produce two or three harvests a year (1). They build terraces on steep slopes (1), creating new flat fields and reducing soil erosion, so more land can be farmed (1). They add manure or fertiliser (1), keeping the soil fertile so yields stay high even with less fallow (1). Accept any other appropriate response.

  2. 1 mark

    Explains how this increases food production

    The explanation must show how the change increases the amount of food produced. Do not credit 'they invent things' with no example.

Question 4

4 marks

Using your own knowledge, explain two reasons why Boserup's theory may not apply in every place.

Model answer

First, the poorest farmers may not have the money to buy fertilisers, irrigation pumps or improved seeds, and may not have access to training. So even when population grows, they cannot intensify their farming, and yields stay low. Second, some places have physical limits. In dry areas there may not be enough water to irrigate more land, and farming steep slopes more intensively can cause soil erosion, so yields can fall instead of rising.

Explanation

Boserup assumed that people can always respond to pressure with innovation; good answers explain why money, the environment or politics can prevent this. Each reason needs a cause (1) and an explanation of why food production does not rise (1).

Mark scheme
  1. 1 mark

    Identifies a first reason, e.g. poor farmers cannot afford new technology / intensive farming can degrade land / water or land may be physically limited / climate change reduces yields / conflict or poor government / population may grow faster than innovation

    Award 1 mark for each reason and 1 mark for its explanation, up to 2 marks for each reason. Examples: The poorest farmers may not be able to afford fertilisers, irrigation or improved seeds (1), so population pressure does not lead to higher yields (1). Farming the land more intensively can cause soil erosion or salinisation (1), so yields eventually fall instead of rising (1). Some places have physical limits, such as too little water or very steep, thin soils (1), so there is no technology that can raise production enough (1). Climate change brings more droughts and heatwaves (1), which can cancel out gains from new technology (1). War or weak government can stop farmers investing or getting their crops to market (1), so innovation does not happen (1). Accept any other appropriate response.

  2. 1 mark

    Explains the first reason

    The explanation must show why population pressure does not lead to more food (or resources) in that place.

  3. 1 mark

    Identifies a second, different reason

    The two reasons must be different (e.g. one economic and one physical).

  4. 1 mark

    Explains the second reason

    As for the first explanation.

Ready to try the rest? Every answer you write is marked against the mark scheme, so you can see exactly where the marks are.

Study Helper Hints first, answers after you try

Stuck on this one? Ask for a hint and I’ll point you in the right direction, without giving the answer away. Once you’ve checked your answer, I’ll show you how the marks are awarded.