Level:
Correct: 0
Incorrect: 0
Marks: 0/0
Exam Practice
Course:
Topics:
Avg
score:
–
Topics
done:
0/20

Energy resources: classification and environmental impacts

Practise 26 exam-style questions on Energy resources: classification and environmental impacts for Edexcel GCSE Geography B (Paper 3). Write your answer as you would in the exam and get it marked in seconds against the mark scheme, point by point, with the Study Helper on hand if you get stuck.

  • 26 questions
  • 1–8 marks each
  • Instant marking
  • No sign-up needed
20 questions, marked as you go

Sample questions with model answers

Here are 4 of the questions in this topic, each with a model answer, an explanation of why it earns the marks and the mark scheme an examiner would use.

Question 1

1 mark

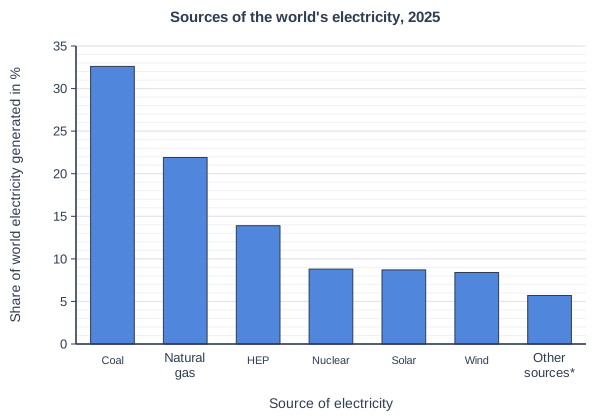
Study Figure 1, which shows the sources of the world's electricity in 2025. *Other sources include oil, bioenergy and geothermal power.

Source: Energy Institute, Statistical Review of World Energy 2026.

Identify the percentage of the world's electricity that was generated from the renewable flows of HEP, solar and wind in 2025.

Choose your answer.

  • A 17.1%
  • B 31.0%
  • C 39.8%
  • D 54.5%
Sources of the world's electricity, 2025. Bar chart of share of world electricity generated in % for each source of electricity: Coal 32.6, Natural gas 21.9, HEP 13.9, Nuclear 8.8, Solar 8.7, Wind 8.4, Other sources* 5.7.

Model answer

B

Explanation

HEP 13.9% + solar 8.7% + wind 8.4% = 31.0%. Nuclear is classified as recyclable, so it is not added, and the 'other sources' bar cannot be used because it mixes resources of different types.

Mark scheme
  1. 1 mark

    B (31.0%)

    Accept the letter or the option written out; do not credit more than one answer. A is incorrect: this adds solar and wind only and leaves out HEP (13.9%). C is incorrect: this also adds nuclear (8.8%), which is classified as recyclable, not as a renewable flow. D is incorrect: this is the share from coal and natural gas, which are non-renewable. All other answers are incorrect.
Question 2

1 mark

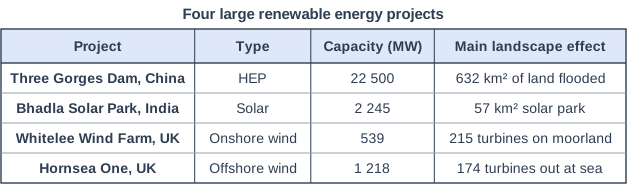
Study Figure 1, which shows four large renewable energy projects.

Sources: figures published by the project operators and governments, compiled for this course in 2026.

Calculate the area of land flooded by the Three Gorges Dam for each 1000 MW of its capacity.

Four large renewable energy projects. Table with columns "Project", "Type", "Capacity (MW)", "Main landscape effect". Project: Three Gorges Dam, China; Type: HEP; Capacity (MW): 22 500; Main landscape effect: 632 km² of land flooded | Project: Bhadla Solar Park, India; Type: Solar; Capacity (MW): 2 245; Main landscape effect: 57 km² solar park | Project: Whitelee Wind Farm, UK; Type: Onshore wind; Capacity (MW): 539; Main landscape effect: 215 turbines on moorland | Project: Hornsea One, UK; Type: Offshore wind; Capacity (MW): 1 218; Main landscape effect: 174 turbines out at sea.

Model answer

22 500 MW = 22.5 × 1000 MW
632 ÷ 22.5 = 28.1 km² for each 1000 MW

Explanation

22 500 MW is 22.5 lots of 1000 MW, so divide the flooded area by 22.5. Dividing the capacity by the area, or dividing by 22 500, answers a different question.

Mark scheme
  1. 1 mark

    28.1 km² (632 ÷ 22.5 = 28.09)

    Accept 28, 28.1 or 28.09, with or without units. Correct answer with no working scores full marks. Do not credit 0.028 (km² per single MW) or 35.6 (22 500 ÷ 632).

Question 3

2 marks

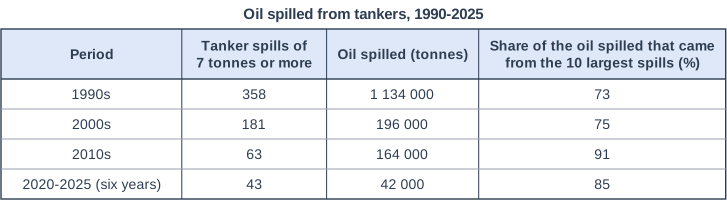
Study Figure 1, which shows the oil spilled from tankers between 1990 and 2025.

Source: ITOPF, Oil Tanker Spill Statistics 2025.

Using evidence from Figure 1, suggest one reason why the amount of oil spilled from tankers can change greatly from one decade to the next.

Oil spilled from tankers, 1990-2025. Table with columns "Period", "Tanker spills of 7 tonnes or more", "Oil spilled (tonnes)", "Share of the oil spilled that came from the 10 largest spills (%)". Period: 1990s; Tanker spills of 7 tonnes or more: 358; Oil spilled (tonnes): 1 134 000; Share of the oil spilled that came from the 10 largest spills (%): 73 | Period: 2000s; Tanker spills of 7 tonnes or more: 181; Oil spilled (tonnes): 196 000; Share of the oil spilled that came from the 10 largest spills (%): 75 | Period: 2010s; Tanker spills of 7 tonnes or more: 63; Oil spilled (tonnes): 164 000; Share of the oil spilled that came from the 10 largest spills (%): 91 | Period: 2020-2025 (six years); Tanker spills of 7 tonnes or more: 43; Oil spilled (tonnes): 42 000; Share of the oil spilled that came from the 10 largest spills (%): 85.

Model answer

In every decade most of the oil came from just the 10 largest spills - 91% in the 2010s. So one very large accident, such as a fully loaded tanker running aground, can add a huge amount of oil to the total, and the amount spilled depends on whether a few big disasters happen in that decade.

Explanation

Use the evidence in Figure 1 that a few large spills make up most of the total (1), then explain why that makes the amount jump from decade to decade (1). Answers that ignore Figure 1 cannot gain the first mark.

Mark scheme
  1. 1 mark

    Suggests a valid reason using evidence from Figure 1, e.g. most of the oil spilled comes from a few very large spills (73% to 91% from the 10 largest)

    Award 1 mark for a basic suggestion based on Figure 1 and 1 mark for developing it. Examples: Between 73% and 91% of the oil spilled in each decade came from just the 10 largest spills (1), so one very large accident, such as a loaded supertanker running aground, can add a huge amount in a single decade (1). The number of spills fell from 181 in the 2000s to 63 in the 2010s, but the amount spilled fell only from 196 000 to 164 000 tonnes (1), which suggests that a few big spills in the 2010s decided the total (1). Accept any other appropriate response. The first mark needs evidence from Figure 1.

  2. 1 mark

    Develops the suggestion, e.g. so a single major accident can add a very large amount of oil in one decade

Question 4

4 marks

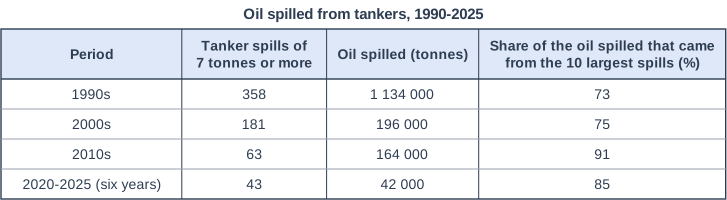
Study Figure 1, which shows the oil spilled from tankers between 1990 and 2025.

Source: ITOPF, Oil Tanker Spill Statistics 2025.

Using Figure 1 and your own knowledge, explain two reasons why oil spills from tankers are still a threat to coastal environments, even though the number of spills has fallen.

Oil spilled from tankers, 1990-2025. Table with columns "Period", "Tanker spills of 7 tonnes or more", "Oil spilled (tonnes)", "Share of the oil spilled that came from the 10 largest spills (%)". Period: 1990s; Tanker spills of 7 tonnes or more: 358; Oil spilled (tonnes): 1 134 000; Share of the oil spilled that came from the 10 largest spills (%): 73 | Period: 2000s; Tanker spills of 7 tonnes or more: 181; Oil spilled (tonnes): 196 000; Share of the oil spilled that came from the 10 largest spills (%): 75 | Period: 2010s; Tanker spills of 7 tonnes or more: 63; Oil spilled (tonnes): 164 000; Share of the oil spilled that came from the 10 largest spills (%): 91 | Period: 2020-2025 (six years); Tanker spills of 7 tonnes or more: 43; Oil spilled (tonnes): 42 000; Share of the oil spilled that came from the 10 largest spills (%): 85.

Model answer

Figure 1 shows that spills still happen: there were 43 spills of 7 tonnes or more between 2020 and 2025. If even a medium-sized spill happens close to the shore, the oil can wash onto beaches and coat seabirds before it can be cleaned up.

Secondly, most of the oil comes from a few very large spills - 91% of the oil spilled in the 2010s came from just 10 incidents. So one accident to a large tanker near a coast could still pollute hundreds of kilometres of coastline and harm marshes and fisheries for years.

Explanation

Each reason needs evidence from Figure 1 (1) and an explanation from your own knowledge of why coasts are still at risk (1). Answers without evidence from Figure 1 are limited to 3 marks.

Mark scheme
  1. 1 mark

    Identifies a first reason using Figure 1, e.g. there were still 43 spills in 2020-2025 / 42 000 tonnes were lost in six years / most oil comes from a few large spills

    Max 3 if no data or evidence from Figure 1 is used. In each case award 1 mark for a point based on information from Figure 1 and 1 mark for further explanation using own knowledge, up to 4 marks. Examples: There were still 43 spills of 7 tonnes or more between 2020 and 2025 (1), and even a medium-sized spill can coat beaches and kill seabirds if it happens close to a coast (1). Most oil comes from a few very large spills, 91% in the 2010s (1), so a single accident to a large tanker can still pollute hundreds of kilometres of coastline (1). 42 000 tonnes of oil were lost in the six years to 2025 (1), and oil that reaches salt marshes or mangroves sinks into the mud and can stay there for many years (1). Accept any other appropriate response.

  2. 1 mark

    Explains the first reason using own knowledge

  3. 1 mark

    Identifies a second, different reason using Figure 1

    The two reasons must be different, e.g. one about how often spills still happen and one about the size of the largest spills.

  4. 1 mark

    Explains the second reason using own knowledge

Ready to try the rest? Every answer you write is marked against the mark scheme, so you can see exactly where the marks are.

Study Helper Hints first, answers after you try

Stuck on this one? Ask for a hint and I’ll point you in the right direction, without giving the answer away. Once you’ve checked your answer, I’ll show you how the marks are awarded.