Level:
Correct: 0
Incorrect: 0
Marks: 0/0
Exam Practice
Course:
Topics:
Avg
score:
–
Topics
done:
0/20

Global oil: reserves, consumption and prices

Practise 26 exam-style questions on Global oil: reserves, consumption and prices for Edexcel GCSE Geography B (Paper 3). Write your answer as you would in the exam and get it marked in seconds against the mark scheme, point by point, with the Study Helper on hand if you get stuck.

  • 26 questions
  • 1–8 marks each
  • Instant marking
  • No sign-up needed
20 questions, marked as you go

Sample questions with model answers

Here are 4 of the questions in this topic, each with a model answer, an explanation of why it earns the marks and the mark scheme an examiner would use.

Question 1

1 mark

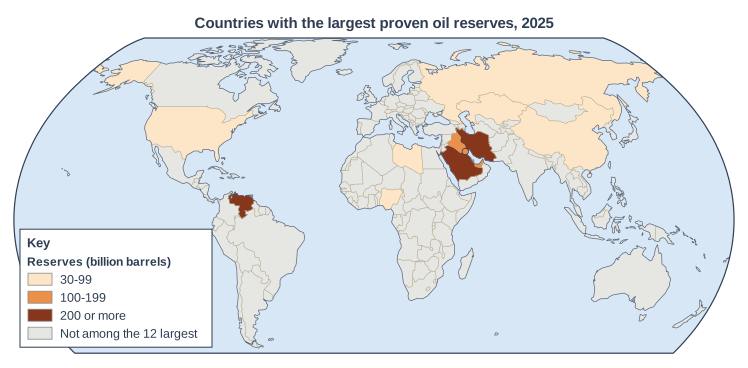
Study Figure 1, which shows the 12 countries with the largest proven oil reserves at the end of 2025.

Source: OPEC, Annual Statistical Bulletin 2026 (figures as reported in news coverage of the bulletin). OPEC counts only a small part of Canada's oil sands as proven reserves, so Canada is not among the 12 countries.

Identify the continent that has at least one country in each of the three classes of reserves shown in Figure 1.

Choose your answer.

  • A Africa
  • B Europe
  • C Asia
  • D South America
Map of the world, titled "Countries with the largest proven oil reserves, 2025". Countries are shaded in 3 classes (key heading "Reserves (billion barrels)"): "30-99" (lightest): 6 countries (2 in Africa, 2 in Asia, 1 in Europe, 1 in North America); "100-199" (medium): 3 countries (3 in Asia); "200 or more" (darkest): 3 countries (2 in Asia, 1 in South America). Other countries are grey, shown in the key as "Not among the 12 largest". Kuwait is too small to see at this scale, so it is marked with a small shaded circle. The key (in a box on the map) shows: the heading "Reserves (billion barrels)", "30-99", "100-199", "200 or more" and "Not among the 12 largest".

Model answer

C

Explanation

Asia is the only continent with countries in all three classes: China and Kazakhstan (30-99 billion barrels), Iraq, the UAE and Kuwait (100-199) and Saudi Arabia and Iran (200 or more). Each of the other continents has countries in only one class. A common error is to forget that the Middle East, where most of these countries are, is part of Asia.

Mark scheme
  1. 1 mark

    C (Asia)

    Accept the letter or the option written out; do not credit more than one answer. Asia has China and Kazakhstan in the 30-99 class, Iraq, the United Arab Emirates and Kuwait in the 100-199 class, and Saudi Arabia and Iran in the 200 or more class (the Middle East is part of Asia). A is incorrect: the African countries shown, Libya and Nigeria, are both in the 30-99 class. B is incorrect: Russia, the only country shown that is partly in Europe, is only in the 30-99 class. D is incorrect: the only South American country shown, Venezuela, is in the 200 or more class. All other answers are incorrect.
Question 2

1 mark

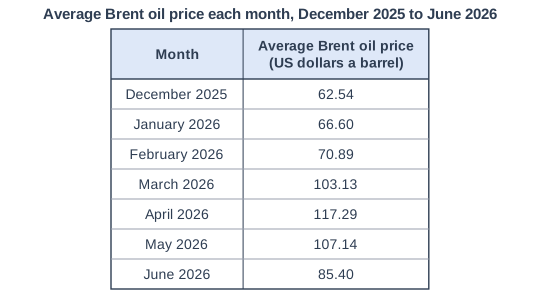
Study Figure 1, which shows US crude oil production and the average price of Brent crude oil in selected years between 2010 and 2025.

Source: US Energy Information Administration (2026).

Calculate the fall in the average Brent oil price between 2014 and 2016.

US crude oil production and the oil price, 2010-2025. Table with columns "Year", "US crude oil production (million barrels a day)", "Average Brent oil price (US dollars a barrel)". Year: 2010; US crude oil production (million barrels a day): 5.5; Average Brent oil price (US dollars a barrel): 79.6 | Year: 2012; US crude oil production (million barrels a day): 6.5; Average Brent oil price (US dollars a barrel): 111.6 | Year: 2014; US crude oil production (million barrels a day): 8.8; Average Brent oil price (US dollars a barrel): 99.0 | Year: 2015; US crude oil production (million barrels a day): 9.4; Average Brent oil price (US dollars a barrel): 52.3 | Year: 2016; US crude oil production (million barrels a day): 8.9; Average Brent oil price (US dollars a barrel): 43.6 | Year: 2017; US crude oil production (million barrels a day): 9.4; Average Brent oil price (US dollars a barrel): 54.1 | Year: 2018; US crude oil production (million barrels a day): 11.0; Average Brent oil price (US dollars a barrel): 71.3 | Year: 2019; US crude oil production (million barrels a day): 12.3; Average Brent oil price (US dollars a barrel): 64.3 | Year: 2020; US crude oil production (million barrels a day): 11.3; Average Brent oil price (US dollars a barrel): 42.0 | Year: 2022; US crude oil production (million barrels a day): 12.0; Average Brent oil price (US dollars a barrel): 100.9 | Year: 2023; US crude oil production (million barrels a day): 13.0; Average Brent oil price (US dollars a barrel): 82.5 | Year: 2024; US crude oil production (million barrels a day): 13.3; Average Brent oil price (US dollars a barrel): 80.5 | Year: 2025; US crude oil production (million barrels a day): 13.7; Average Brent oil price (US dollars a barrel): 69.1.

Model answer

99.0 - 43.6 = 55.4 US dollars a barrel

Explanation

Subtract the 2016 price from the 2014 price. Make sure you use the price column and not the production column.

Mark scheme
  1. 1 mark

    55.4 US dollars a barrel (99.0 - 43.6)

    Accept 55.4 or 55, with or without units. Correct answer with no working scores full marks. Do not credit 142.6 (adding the two values).

Question 3

2 marks

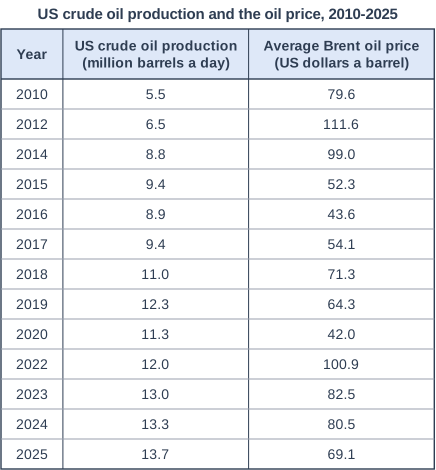
Study Figure 1, which shows the average price of Brent crude oil each month from December 2025 to June 2026.

On 28 February 2026, US and Israeli strikes on Iran began. Tanker traffic through the Strait of Hormuz, which normally carries about one-fifth of the world's oil supply, almost stopped. On 11 March 2026, members of the International Energy Agency (IEA) agreed to release a record 400 million barrels of oil from their emergency stocks.

Source: US Energy Information Administration (prices, 2026); IEA (2026).

Calculate the percentage increase in the average monthly Brent oil price between February 2026 and April 2026.

Answer to one decimal place. Show your working.

Average Brent oil price each month, December 2025 to June 2026. Table with columns "Month", "Average Brent oil price (US dollars a barrel)". Month: December 2025; Average Brent oil price (US dollars a barrel): 62.54 | Month: January 2026; Average Brent oil price (US dollars a barrel): 66.60 | Month: February 2026; Average Brent oil price (US dollars a barrel): 70.89 | Month: March 2026; Average Brent oil price (US dollars a barrel): 103.13 | Month: April 2026; Average Brent oil price (US dollars a barrel): 117.29 | Month: May 2026; Average Brent oil price (US dollars a barrel): 107.14 | Month: June 2026; Average Brent oil price (US dollars a barrel): 85.40.

Model answer

117.29 - 70.89 = 46.40
46.40 ÷ 70.89 × 100 = 65.5%

Explanation

Find the increase, divide it by the February (starting) price and multiply by 100. A common error is to divide by the April price, which gives 39.6%.

Mark scheme
  1. 1 mark

    Method: (117.29 - 70.89) ÷ 70.89 × 100, or 46.40 ÷ 70.89 × 100 (correct answer 65.5%)

    Award 2 marks for the correct answer of 65.5%. If the answer is correct but no working is shown award 2 marks. If the answer is incorrect, or is not given to one decimal place, award 1 mark for a correct method (the increase divided by the February price, multiplied by 100). Accept 65.5 with or without the % sign.

  2. 1 mark

    Answer: 65.5%

    Must be given to one decimal place: do not credit 65 or 65.45 for this mark (the method mark can still be awarded for a correct method). Do not credit 39.6 (dividing by the April price).

Question 4

4 marks

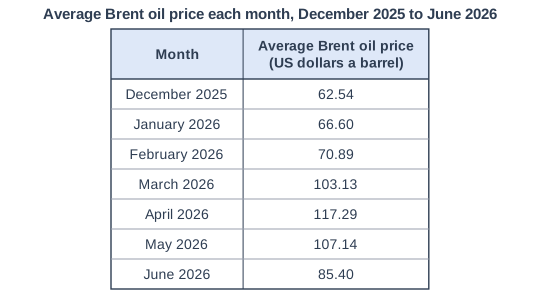
Study Figure 1, which shows the average price of Brent crude oil each month from December 2025 to June 2026.

On 28 February 2026, US and Israeli strikes on Iran began. Tanker traffic through the Strait of Hormuz, which normally carries about one-fifth of the world's oil supply, almost stopped. On 11 March 2026, members of the International Energy Agency (IEA) agreed to release a record 400 million barrels of oil from their emergency stocks.

Source: US Energy Information Administration (prices, 2026); IEA (2026).

Using evidence from Figure 1 and your own knowledge, explain two reasons for the changes in the oil price between February and June 2026.

Average Brent oil price each month, December 2025 to June 2026. Table with columns "Month", "Average Brent oil price (US dollars a barrel)". Month: December 2025; Average Brent oil price (US dollars a barrel): 62.54 | Month: January 2026; Average Brent oil price (US dollars a barrel): 66.60 | Month: February 2026; Average Brent oil price (US dollars a barrel): 70.89 | Month: March 2026; Average Brent oil price (US dollars a barrel): 103.13 | Month: April 2026; Average Brent oil price (US dollars a barrel): 117.29 | Month: May 2026; Average Brent oil price (US dollars a barrel): 107.14 | Month: June 2026; Average Brent oil price (US dollars a barrel): 85.40.

Model answer

The price rose from 70.89 US dollars a barrel in February to 117.29 dollars in April. This was because tanker traffic through the Strait of Hormuz almost stopped after the strikes on Iran began, cutting off about a fifth of the world's oil supply. With much less oil available, buyers competed for the remaining supply and the price rose sharply.

The price then fell to 85.40 dollars in June. One reason is that IEA members released 400 million barrels of oil from their emergency stocks, which added to supply and eased the shortage. Very high prices may also have reduced demand, as people and businesses cut their use of fuel.

Explanation

Each reason needs evidence from Figure 1 (1) and an explanation of how supply or demand changed (1). Explaining both the rise and the fall is a good way to give two different reasons. Answers without evidence from Figure 1 are limited to 3 marks.

Mark scheme
  1. 1 mark

    Identifies a first reason linked to evidence from Figure 1, e.g. the price rose from 70.89 to 117.29 US dollars between February and April because supply through the Strait of Hormuz was cut

    Max 3 if no data or evidence from Figure 1 is used. In each case award 1 mark for a point based on information from Figure 1 and 1 mark for further explanation using own knowledge, up to 4 marks. Examples: The price rose from 70.89 US dollars in February to 117.29 in April (1) because tanker traffic through the Strait of Hormuz almost stopped, so about a fifth of the world's oil supply was cut off and there was an under-supply (1). The price jumped by over 30 US dollars in March (1) because buyers feared that the conflict would spread and cut supplies for a long time, so they rushed to buy oil and build up stocks (1). The price fell from 117.29 in April to 85.40 in June (1) because the release of 400 million barrels from emergency stocks added to supply (1). Prices fell back after April (1) because very high prices reduce demand, as people and businesses use less fuel (1). The price fell after April (1) because supply recovered as some tankers began to pass through the strait again (1). Accept any other appropriate response.

  2. 1 mark

    Explains the first reason using own knowledge

  3. 1 mark

    Identifies a second, different reason linked to Figure 1

    The two reasons must be different, e.g. one explaining the rise and one explaining the fall, or two different causes of the rise.

  4. 1 mark

    Explains the second reason using own knowledge

    Do not credit 'there was a war' without explaining how it affected supply, demand or prices.

Ready to try the rest? Every answer you write is marked against the mark scheme, so you can see exactly where the marks are.

Study Helper Hints first, answers after you try

Stuck on this one? Ask for a hint and I’ll point you in the right direction, without giving the answer away. Once you’ve checked your answer, I’ll show you how the marks are awarded.