
Level:
Correct: 0
Incorrect: 0
Marks: 0/0
Exam Practice
Course:
Topics:
Avg
score:
–
Topics
done:
0/20

Reducing reliance on fossil fuels

Practise 26 exam-style questions on Reducing reliance on fossil fuels for Edexcel GCSE Geography B (Paper 3). Write your answer as you would in the exam and get it marked in seconds against the mark scheme, point by point, with the Study Helper on hand if you get stuck.

  • 26 questions
  • 1–8 marks each
  • Instant marking
  • No sign-up needed
20 questions, marked as you go

Sample questions with model answers

Here are 4 of the questions in this topic, each with a model answer, an explanation of why it earns the marks and the mark scheme an examiner would use.

Question 1

1 mark

Study Figure 1, which shows the share of world electricity generated by each source in 2025 (source: Energy Institute Statistical Review of World Energy 2026). Other includes oil and bioenergy.

Identify which one of the following statements is supported by Figure 1.

Choose your answer.

  • A Hydro, solar and wind together generated more electricity than coal
  • B Solar generated more electricity than nuclear
  • C Gas generated more electricity than hydro, solar and wind combined
  • D Coal generated more electricity than any other single source
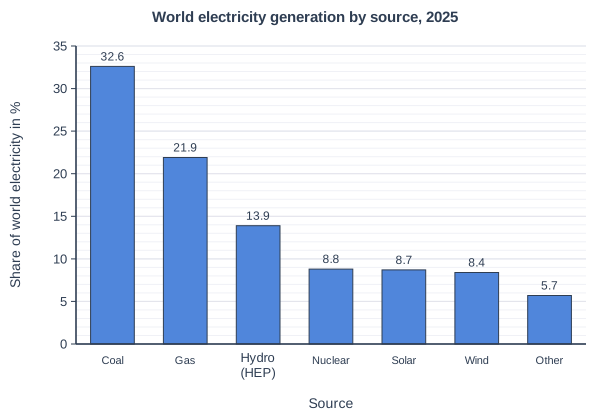
World electricity generation by source, 2025. Bar chart of share of world electricity in % for each source: Coal 32.6, Gas 21.9, Hydro (HEP) 13.9, Nuclear 8.8, Solar 8.7, Wind 8.4, Other 5.7.

Model answer

D

Explanation

Coal was still the largest single source of world electricity in 2025, at 32.6%. Check each statement against the values: several of the wrong options are close, so they must be added or compared carefully.

Mark scheme
  1. 1 mark

    D (Coal generated more electricity than any other single source)

    Accept the letter or the option written out; do not credit more than one answer. D is correct: coal generated 32.6%, more than any other source. A is incorrect: hydro, solar and wind together generated 31.0%, less than coal (32.6%). B is incorrect: solar generated 8.7%, slightly less than nuclear (8.8%). C is incorrect: gas generated 21.9%, less than hydro, solar and wind combined (31.0%).
Question 2

2 marks

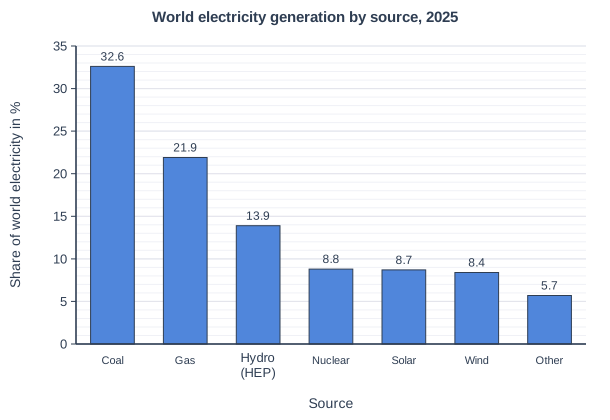
Study Figure 1, which shows the share of world electricity generated by each source in 2025 (source: Energy Institute Statistical Review of World Energy 2026). Other includes oil and bioenergy.

Calculate the ratio of the electricity generated by coal and gas to the electricity generated by solar and wind. Give your answer in the form n : 1, to one decimal place. Show your working.

World electricity generation by source, 2025. Bar chart of share of world electricity in % for each source: Coal 32.6, Gas 21.9, Hydro (HEP) 13.9, Nuclear 8.8, Solar 8.7, Wind 8.4, Other 5.7.

Model answer

Coal + gas = 32.6 + 21.9 = 54.5
Solar + wind = 8.7 + 8.4 = 17.1
54.5 ÷ 17.1 = 3.187...
Ratio = 3.2 : 1

Explanation

Add each pair of sources first, then divide the larger total by the smaller to give n : 1. A common error is to divide before adding, or to give the ratio the wrong way round.

Mark scheme
  1. 1 mark

    Method: (32.6 + 21.9) : (8.7 + 8.4) = 54.5 : 17.1, or 54.5 ÷ 17.1 (correct answer 3.2 : 1; accept 3.2 : 1 or 3.2)

    Correct answer (3.2 : 1) with no working scores full marks (2 marks). Award 1 mark for a correct method with a wrong or wrongly rounded answer (e.g. 3.19 : 1 or 3 : 1).

  2. 1 mark

    Answer: 3.2 : 1

    Accept 3.2 : 1 or 3.2. Do not accept 3 : 1 or 3.19 : 1 for this mark (the question asks for one decimal place).

Question 3

2 marks

Using your own knowledge, state two ways in which governments can encourage people to use less energy for transport.

Model answer

Invest in cheaper, more frequent public transport.
Build safe cycle lanes so people can cycle instead of driving.

Explanation

Any two different government actions that reduce the energy used for travel score a mark each. Measures that make cars more efficient, such as grants for electric cars, can be credited, but the clearest answers reduce the amount of travel or move people to modes that use less energy per person.

Mark scheme
  1. 1 mark

    First way, e.g. invest in public transport / lower public transport fares / build cycle lanes / raise fuel taxes / congestion charges or low-emission zones / lower speed limits / encourage working from home

    Award 1 mark for each different way. Accept any other appropriate response. Do not credit two ways that are the same (e.g. 'more buses' and 'better buses').

  2. 1 mark

    Second, different way

Question 4

4 marks

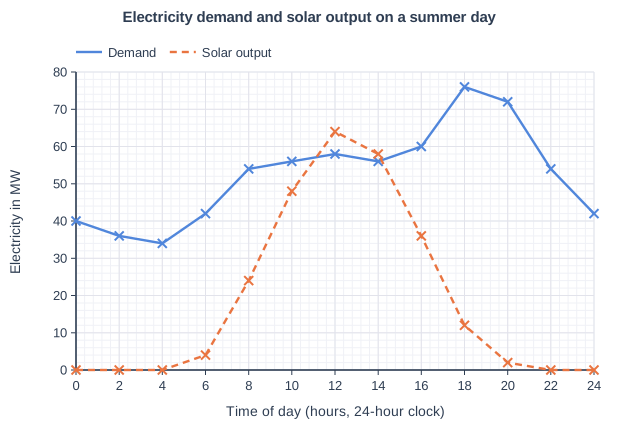
Study Figure 1, which shows electricity demand and the output of solar panels in an imaginary town on a sunny summer day. The data were written for this course.

Using evidence from Figure 1 and your own knowledge, suggest two ways in which the town could meet its demand for electricity in the evening without burning more fossil fuels.

Electricity demand and solar output on a summer day. Line graph of Electricity in MW (y-axis, 0 to 80) against time of day (hours, 24-hour clock) (x-axis, 0 to 24). "Demand" joins the points (0, 40), (2, 36), (4, 34), (6, 42), (8, 54), (10, 56), (12, 58), (14, 56), (16, 60), (18, 76), (20, 72), (22, 54), (24, 42). "Solar output" (dashed) joins the points (0, 0), (2, 0), (4, 0), (6, 4), (8, 24), (10, 48), (12, 64), (14, 58), (16, 36), (18, 12), (20, 2), (22, 0), (24, 0).

Model answer

Figure 1 shows that at 12:00 the solar panels produce 64 MW but demand is only 58 MW, so there is spare electricity in the middle of the day. This could be stored in large batteries and released in the evening, when demand peaks at 76 MW at 18:00 but solar gives only 12 MW.

The town could also build wind turbines. Solar output falls to almost nothing after 20:00, but wind can blow at night, so wind power could supply some of the evening demand without using gas.

Explanation

Each way needs a point linked to the evidence in Figure 1, such as the midday surplus or the evening peak (1), and a development explaining how it meets evening demand (1). Without evidence from the figure the maximum is 3 marks.

Mark scheme
  1. 1 mark

    First way, using evidence from Figure 1, e.g. store surplus solar electricity from the middle of the day (at 12:00 solar output of 64 MW is more than demand of 58 MW) in batteries for use in the evening / use pumped-storage HEP / add wind power / shift demand to the middle of the day

    Max 3 if no data or evidence from Figure 1 is used. Award 1 mark for each way and 1 mark for its development, up to 2 marks per way. The two ways must be different. Examples: At 12:00 solar output (64 MW) is greater than demand (58 MW) (1), so the surplus could be stored in large batteries and released at 18:00, when demand peaks at 76 MW but solar gives only 12 MW (1). Pumped-storage HEP could use surplus solar power to pump water uphill at midday (1) and release it through turbines in the evening peak (1). Wind turbines can generate after sunset (1), so adding wind would fill the evening gap when solar output falls to almost 0 MW after 20:00 (1). Smart charging and pricing could encourage people to charge electric cars or run appliances at midday (1), moving some demand away from the evening peak (1). Electricity could be imported through the grid from other areas with wind or HEP (1). Accept any other appropriate response. Readings within half a gridline (plus or minus 1 MW) of the values given are acceptable.

  2. 1 mark

    Develops the first way

  3. 1 mark

    Second, different way, using evidence from Figure 1

  4. 1 mark

    Develops the second way

Ready to try the rest? Every answer you write is marked against the mark scheme, so you can see exactly where the marks are.

Study Helper Hints first, answers after you try

Stuck on this one? Ask for a hint and I’ll point you in the right direction, without giving the answer away. Once you’ve checked your answer, I’ll show you how the marks are awarded.