
Level:
Correct: 0
Incorrect: 0
Marks: 0/0
Exam Practice
Course:
Topics:
Edexcel GCSE Biology (Paper 2) Smart practice A mixed round aimed at your weak spots
Unit 1
Key concepts in biology
Unit 6
Plant structures and their functions
Unit 7
Animal coordination, control and homeostasis
Unit 8
Exchange and transport in animals
Unit 9
Ecosystems and material cycles
Avg
score:
–
Topics
done:
0/38

Water uptake and transpiration rates

Practise 15 exam-style questions on Water uptake and transpiration rates for Edexcel GCSE Biology (Paper 2). Write your answer as you would in the exam and get it marked in seconds against the mark scheme, point by point, with the Study Helper on hand if you get stuck.

  • 15 questions
  • 1–6 marks each
  • Instant marking
  • No sign-up needed
15 questions, marked as you go

Sample questions with model answers

Here are 4 of the questions in this topic, each with a model answer, an explanation of why it earns the marks and the mark scheme an examiner would use.

Question 1

1 mark

A bubble potometer is often used to investigate transpiration.

What does a bubble potometer measure?

Choose your answer.

  • A the rate of photosynthesis
  • B the rate of water uptake
  • C the rate of sucrose transport
  • D the exact water lost by leaves

Model answer

B - the rate of water uptake

Explanation

The bubble moves as the shoot draws water up its xylem, so a potometer measures water uptake. Most of this water is lost by transpiration, so it is used to estimate the rate of transpiration, but a small amount stays in the plant, for example for photosynthesis.

Mark scheme
  1. 1 mark

    B / the rate of water uptake (1)

    The only correct answer is B. A is not correct because the potometer measures water movement, not oxygen production or carbon dioxide uptake. C is not correct because sucrose is transported in the phloem by translocation, which a potometer does not measure. D is not correct because some of the water taken up is used by the shoot (for example in photosynthesis or to keep cells turgid), so the water taken up is not exactly the water lost from the leaves. Accept the letter or the option. If more than one option is given, do not award the mark.
Question 2

2 marks

A student measured the distance moved by the air bubble in a potometer in 5 minutes. He repeated the measurement five times with the same shoot, and tried to keep the conditions the same each time.

Distances in mm: 42, 45, 31, 44, 43

Identify the anomalous result.

Suggest one reason for this result.

Model answer

The anomalous result is 31 mm, because it is much lower than the other four results (42 to 45 mm). One possible reason is that the light intensity was lower during this test, for example because a cloud passed over the Sun, so the shoot transpired more slowly and took up less water.

Explanation

An anomalous result does not fit the pattern of the other repeats: 31 mm is far below the others, which are all between 42 and 45 mm. A good reason must explain a smaller distance, such as a leak in the apparatus, the reservoir tap being open or a fall in light intensity, temperature or air movement during that test. Vague answers such as human error do not score.

Mark scheme
  1. 1 mark

    31 (mm) (1)

    Point 1 is for the anomalous result; points 2 to 7 are alternative reasons: award a maximum of 1 mark from points 2 to 7 (max 2 in total). Accept the third result.

  2. 1 mark

    air leaked into the apparatus / a joint was not airtight (1)

    max 1 from points 2 to 7

  3. 1 mark

    the reservoir tap was (partly) open, so water was drawn from the reservoir instead of along the capillary tube (1)

    max 1 from points 2 to 7

  4. 1 mark

    the bubble was timed for less than 5 minutes / the stopwatch was stopped too early (1)

    max 1 from points 2 to 7

  5. 1 mark

    the conditions changed during this test, e.g. lower light intensity / a lower temperature / stiller air / more humid air, so the shoot transpired more slowly (1)

    max 1 from points 2 to 7. A change that would lower the rate of transpiration is needed; do not accept a change that would raise it, e.g. brighter light

  6. 1 mark

    air entered the xylem of the shoot, so less water could be drawn up (1)

    max 1 from points 2 to 7

  7. 1 mark

    the distance was read / recorded incorrectly (1)

    max 1 from points 2 to 7. Do not accept human error or a mistake without saying what it was

Question 3

3 marks

Shoots from two plant species, A and B, were set up in identical potometers in the same conditions for 20 minutes.

Shoot A took up 84 mm³ of water. Its total leaf area was 60 cm².
Shoot B took up 63 mm³ of water. Its total leaf area was 35 cm².

The rate of water uptake per cm² of leaf can be found using the equation:

rate per cm² = volume of water taken up ÷ (time × leaf area)

Determine which shoot had the higher rate of water uptake per cm² of leaf.

You must show your working.

Model answer

Shoot A: 84 ÷ (20 × 60) = 84 ÷ 1200 = 0.07 mm³ per minute per cm²
Shoot B: 63 ÷ (20 × 35) = 63 ÷ 700 = 0.09 mm³ per minute per cm²
Shoot B has the higher rate of water uptake per cm² of leaf, even though shoot A took up more water in total.

Explanation

Shoot A took up more water in total only because it had more leaf area. Dividing by the leaf area as well as the time gives a fair comparison: 0.07 for A and 0.09 for B, so B loses water faster from each cm² of leaf. A common error is to compare only the total volumes.

Mark scheme
  1. 1 mark

    (shoot A) 84 ÷ (20 × 60) = 0.07 (mm³ per minute per cm²) (1)

    the working must be seen (the question says 'You must show your working'); accept 0.070; accept equivalent rates in other units if used consistently for both shoots, e.g. 1.4 mm³ per cm² in 20 minutes (84 ÷ 60)

  2. 1 mark

    (shoot B) 63 ÷ (20 × 35) = 0.09 (mm³ per minute per cm²) (1)

    accept 0.090; accept 1.8 mm³ per cm² in 20 minutes (63 ÷ 35)

  3. 1 mark

    shoot B (has the higher rate per cm²) (1)

    award only when working for both shoots is seen (allow ecf from incorrect values: the shoot with the higher calculated value); 'shoot B' with no working scores 0; do not accept shoot A (which took up more water in total)

Question 4

4 marks

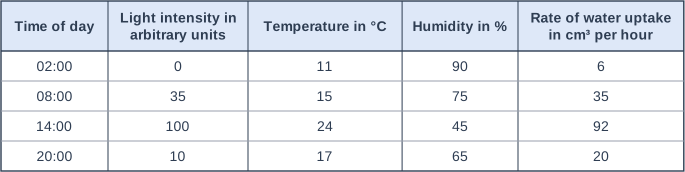
A scientist recorded how fast a young tree took up water at four times during one day in summer. She also recorded the light intensity, air temperature and humidity.

The table shows the results.

Explain the changes in the rate of water uptake during the day.

Table with columns "Time of day", "Light intensity in arbitrary units", "Temperature in °C", "Humidity in %", "Rate of water uptake in cm³ per hour". Time of day: 02:00; Light intensity in arbitrary units: 0; Temperature in °C: 11; Humidity in %: 90; Rate of water uptake in cm³ per hour: 6 | Time of day: 08:00; Light intensity in arbitrary units: 35; Temperature in °C: 15; Humidity in %: 75; Rate of water uptake in cm³ per hour: 35 | Time of day: 14:00; Light intensity in arbitrary units: 100; Temperature in °C: 24; Humidity in %: 45; Rate of water uptake in cm³ per hour: 92 | Time of day: 20:00; Light intensity in arbitrary units: 10; Temperature in °C: 17; Humidity in %: 65; Rate of water uptake in cm³ per hour: 20.

Model answer

The rate of water uptake is lowest at 02:00 (6 cm³ per hour), when it is dark, cool and humid, and highest at 14:00 (92 cm³ per hour), when the light intensity and temperature are highest and the humidity is lowest. In the dark most stomata are closed, so very little water vapour is lost. As the light intensity increases, more stomata open, so more water vapour can diffuse out. A higher temperature gives water molecules more kinetic energy, so water evaporates and diffuses faster, and lower humidity gives a steeper concentration gradient of water vapour between the leaf and the air. All of these increase transpiration, so more water is drawn up the xylem and taken up by the roots.

Explanation

Each factor acts in a different way: light controls whether the stomata are open, temperature affects how fast water evaporates and diffuses, and humidity affects the concentration gradient. Good answers quote the data and link each factor to its effect on transpiration and then to water uptake. Listing the factors without explaining how they work limits the marks.

Mark scheme
  1. 1 mark

    the rate is highest at 14:00 when light intensity and temperature are highest (and humidity is lowest) / lowest at 02:00 when it is dark and coolest (1)

    An explanation linking four from the six points; max 4. accept any correct use of data linking the rate to a factor, e.g. 92 cm³ per hour at 14:00 with light intensity 100 and 24 °C

  2. 1 mark

    in the light / higher light intensity, more stomata open / the stomata open wider (1)

    accept stomata open for photosynthesis

  3. 1 mark

    at 02:00 it is dark so (most) stomata are closed (so very little water is lost) (1)

    accept in the dark the stomata close

  4. 1 mark

    at higher temperature water molecules have more (kinetic) energy so evaporate / diffuse faster (1)

    accept faster evaporation from the leaves at higher temperature

  5. 1 mark

    lower humidity gives a steeper concentration gradient (of water vapour), so faster diffusion (out of the stomata) (1)

    accept ORA for high humidity at 02:00

  6. 1 mark

    more water lost by transpiration, so more water drawn up the xylem / taken up by the roots (1)

    accept the transpiration stream is faster

Ready to try the rest? Every answer you write is marked against the mark scheme, so you can see exactly where the marks are.

Study Helper Hints first, answers after you try

Stuck on this one? Ask for a hint and I’ll point you in the right direction, without giving the answer away. Once you’ve checked your answer, I’ll show you how the marks are awarded.