
Level:
Correct: 0
Incorrect: 0
Marks: 0/0
Exam Practice
Course:
Topics:
Edexcel GCSE Biology (Paper 2) Smart practice A mixed round aimed at your weak spots
Unit 1
Key concepts in biology
Unit 6
Plant structures and their functions
Unit 7
Animal coordination, control and homeostasis
Unit 8
Exchange and transport in animals
Unit 9
Ecosystems and material cycles
Avg
score:
–
Topics
done:
0/38

Photosynthesis and limiting factors

Practise 18 exam-style questions on Photosynthesis and limiting factors for Edexcel GCSE Biology (Paper 2). Write your answer as you would in the exam and get it marked in seconds against the mark scheme, point by point, with the Study Helper on hand if you get stuck.

  • 18 questions
  • 1–6 marks each
  • Instant marking
  • No sign-up needed
18 questions, marked as you go

Sample questions with model answers

Here are 4 of the questions in this topic, each with a model answer, an explanation of why it earns the marks and the mark scheme an examiner would use.

Question 1

1 mark

Light intensity, carbon dioxide concentration and temperature can all be limiting factors for photosynthesis.

State what is meant by a limiting factor.

Model answer

A limiting factor is the factor that is in shortest supply, so it stops the rate of photosynthesis increasing. If the limiting factor is increased, the rate of photosynthesis increases.

Explanation

Only one factor limits the rate at a time: the one in shortest supply. Increasing that factor increases the rate, but increasing the others has no effect. 'A factor that affects the rate' is too vague, because a factor can affect the rate without limiting it.

Mark scheme
  1. 1 mark

    the factor that is in shortest supply, so it stops the rate (of photosynthesis) increasing / a factor which, if it is increased, increases the rate (of photosynthesis) (1)

    accept the factor that is at the lowest level compared with what is needed / that restricts the rate of photosynthesis; do not accept 'a factor that affects the rate of photosynthesis' (all three factors affect the rate, whether or not they are limiting); do not accept 'a factor that stops photosynthesis'
Question 2

2 marks

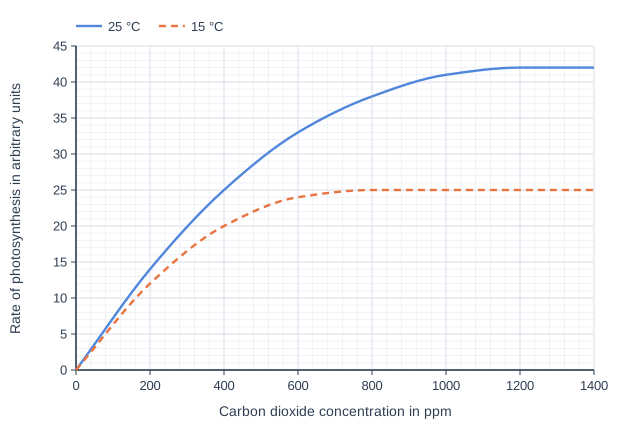
A scientist measured the rate of photosynthesis of pepper plant leaves at different carbon dioxide concentrations, at 15 °C and at 25 °C. The light intensity was high and was the same for all the measurements.

The graph shows the results.

Identify the factor that limits the rate of photosynthesis:
- at 200 ppm carbon dioxide and 25 °C
- at 1200 ppm carbon dioxide and 15 °C.

Line graph of rate of photosynthesis in arbitrary units (y-axis, 0 to 45) against carbon dioxide concentration in ppm (x-axis, 0 to 1400). "25 °C" is a smooth curve through (0, 0), (200, 14), (400, 25), (600, 33), (800, 38), (1000, 41), (1200, 42), (1400, 42). "15 °C" (dashed) is a smooth curve through (0, 0), (200, 12), (400, 20), (600, 24), (800, 25), (1000, 25), (1200, 25), (1400, 25).

Model answer

At 200 ppm carbon dioxide and 25 °C: carbon dioxide concentration.
At 1200 ppm carbon dioxide and 15 °C: temperature.

Explanation

On a rising part of a curve, the factor on the x-axis is limiting. Where the 15 °C curve has levelled off, carbon dioxide is no longer limiting; the higher 25 °C curve shows that raising the temperature would increase the rate, so temperature is limiting. Light cannot be limiting there, because the same light gives a higher rate at 25 °C.

Mark scheme
  1. 1 mark

    (at 200 ppm and 25 °C) carbon dioxide concentration (1)

    the rate is still rising steeply as the carbon dioxide concentration increases; accept carbon dioxide; do not accept light intensity or temperature

  2. 1 mark

    (at 1200 ppm and 15 °C) temperature (1)

    the 15 °C curve has levelled off at 25 units, but at 25 °C the rate is higher (42 units) with the same carbon dioxide concentration and light intensity, so temperature limits the rate; do not accept carbon dioxide concentration (increasing it has no effect) or light intensity

Question 3

3 marks

In the 1600s, the scientist Jan van Helmont planted a young willow tree with a mass of 2.3 kg in a pot containing 90.7 kg of dry soil. He covered the soil and gave the tree only rainwater for five years.

After five years the tree had a mass of 76.7 kg. When the soil was dried and weighed again, it had lost only about 0.06 kg.

Van Helmont concluded that all of the extra mass of the tree had come from the water.

Explain why van Helmont's conclusion was only partly correct.

Model answer

Van Helmont was partly right, because water is one of the reactants in photosynthesis, so some of the extra mass did come from water. He was also right that the mass did not come from the soil, which lost only about 0.06 kg while the tree gained 74.4 kg. But he did not know that carbon dioxide from the air is also used in photosynthesis. The tree used light energy to make glucose from carbon dioxide and water, and used the glucose to make new biomass such as cellulose and starch, so much of the extra mass came from carbon dioxide in the air.

Explanation

Photosynthesis makes glucose from carbon dioxide and water, and the glucose is built into new biomass, so the carbon in a tree comes from the air. Van Helmont's experiment correctly ruled out the soil, but he could not have known about carbon dioxide. Light supplies the energy for photosynthesis, not mass, and oxygen is a product, not a reactant.

Mark scheme
  1. 1 mark

    water is a reactant in photosynthesis / is used in photosynthesis, so some of the extra mass did come from water (1)

    An explanation linking three from the four points; max 3. accept 'he was right that water was used to make the new mass'; ignore water is also stored in the cells of the tree

  2. 1 mark

    carbon dioxide from the air is also used in photosynthesis / some of the extra mass came from carbon dioxide (in the air) (1)

    accept the carbon in the tree came from carbon dioxide; do not accept 'oxygen from the air' (oxygen is a product of photosynthesis); do not accept 'the mass came from sunlight' (light supplies energy, not mass)

  3. 1 mark

    carbon dioxide and water are made into glucose, which is used to make new biomass (e.g. cellulose, starch, proteins) (1)

    accept glucose is used for growth / to make new cells / wood

  4. 1 mark

    the extra mass did not come from the soil, because the soil lost only about 0.06 kg compared with a gain of 74.4 kg (1)

    accept the soil provided only a tiny amount of the mass (as mineral ions)

Question 4

4 marks

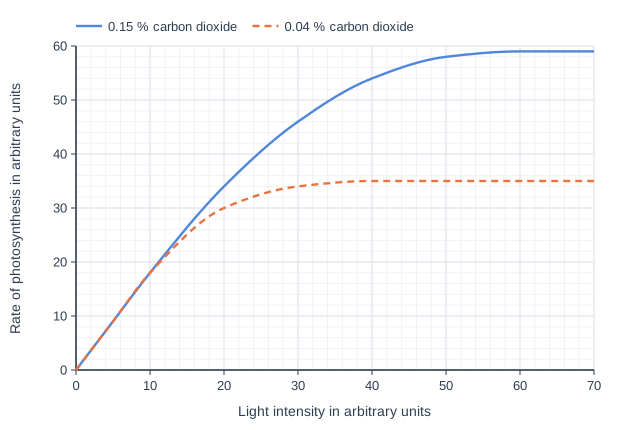
A scientist measured the rate of photosynthesis of wheat leaves at different light intensities, at two concentrations of carbon dioxide: 0.04 % and 0.15 %. The temperature was kept at 20 °C.

The graph shows the results.

Explain the differences between the two curves.

Line graph of rate of photosynthesis in arbitrary units (y-axis, 0 to 60) against light intensity in arbitrary units (x-axis, 0 to 70). "0.15 % carbon dioxide" is a smooth curve through (0, 0), (5, 9), (10, 18), (20, 34), (30, 46), (40, 54), (50, 58), (60, 59), (70, 59). "0.04 % carbon dioxide" (dashed) is a smooth curve through (0, 0), (5, 9), (10, 18), (20, 30), (30, 34), (40, 35), (50, 35), (60, 35), (70, 35).

Model answer

At low light intensities, up to about 10 arbitrary units, the two curves are the same. Here light intensity is the limiting factor, so increasing the carbon dioxide concentration makes no difference to the rate.

At 0.04 % carbon dioxide the rate levels off at 35 arbitrary units from a light intensity of about 30-40. Above this, carbon dioxide concentration is the limiting factor, so more light has no effect. At 0.15 % carbon dioxide the rate keeps rising to a much higher maximum of 59 arbitrary units, because more carbon dioxide is available. Above a light intensity of about 50 to 60 this curve also levels off, because another factor, such as temperature, is now limiting.

Explanation

Two curves that are the same at first and then separate show an interaction between factors: where they overlap, the factor on the x-axis (light) is limiting; where they separate, the factor that differs between them (carbon dioxide) is limiting. When the upper curve levels off, light is no longer limiting, so another factor, such as temperature, must be. A common error is to describe the curves without saying which factor is limiting in each region.

Mark scheme
  1. 1 mark

    at low light intensities (up to about 10 arbitrary units) the rate is the same at both carbon dioxide concentrations (1)

    An explanation linking four from the six points; max 4. accept the curves are the same / overlap at low light intensity

  2. 1 mark

    because light intensity is the limiting factor (so more carbon dioxide has no effect) (1)

    must refer to low light intensities

  3. 1 mark

    at 0.04 % the rate levels off / stops increasing (at 35 arbitrary units) from a light intensity of about 30-40 (1)

    accept the 0.04 % curve levels off at a lower light intensity and a lower rate than the 0.15 % curve

  4. 1 mark

    because carbon dioxide concentration is the limiting factor (at 0.04 %) (1)

    must refer to the 0.04 % curve or to high light intensities

  5. 1 mark

    at 0.15 % the rate keeps increasing to higher light intensities / reaches a higher maximum (59 arbitrary units) (1)

    accept the rate at 0.15 % is up to 24 units higher (59 compared with 35)

  6. 1 mark

    at 0.15 %, above a light intensity of about 50 to 60, the rate levels off because another factor, such as temperature, is now limiting (1)

    accept temperature or carbon dioxide concentration as the factor limiting the top of the 0.15 % curve (the data cannot show which); do not accept light intensity as the limiting factor where the curve has levelled off

Ready to try the rest? Every answer you write is marked against the mark scheme, so you can see exactly where the marks are.

Study Helper Hints first, answers after you try

Stuck on this one? Ask for a hint and I’ll point you in the right direction, without giving the answer away. Once you’ve checked your answer, I’ll show you how the marks are awarded.