Level:
Correct: 0
Incorrect: 0
Marks: 0/0
Exam Practice
Subject:
Topics:
Avg
score:
–
Topics
done:
0/21

Thematic maps and resources

Practise 28 exam-style questions on Thematic maps and resources for AQA GCSE Geography (Paper 3). Write your answer as you would in the exam and get it marked in seconds against the mark scheme, point by point, with an AI tutor on hand if you get stuck.

  • 28 questions
  • 1–6 marks each
  • Instant marking
  • No sign-up needed
20 questions, marked as you go

Sample questions with model answers

Here are 4 of the questions in this topic, each with a model answer, an explanation of why it earns the marks and the mark scheme an examiner would use.

Question 1

1 mark

Which one of the following is the name for an isoline that joins places with the same temperature?

A Isobar
B Isotherm
C Isohyet
D Contour

Give the letter of your answer.

Model answer

B

Explanation

All isolines join places of equal value: isotherms join equal temperature, isobars equal air pressure, isohyets equal rainfall and contours equal height. Isoline maps work best for data that change gradually across an area.

Mark scheme
  1. 1 mark

    B (isotherm)

    Accept the letter or the option written out; do not accept more than one answer.

Question 2

2 marks

Give two disadvantages of using proportional circles to present data on a map.

Model answer

Where sites are close together the circles overlap, making them hard to read. It is also difficult to judge the exact value from the size of a circle, so similar values are hard to compare.

Explanation

Proportional circles show the location and relative size of values at a glance, but because their AREA is proportional to the value, readers find it hard to estimate exact values. Printing the values beside the circles is one way to reduce this problem.

Mark scheme
  1. 1 mark

    Circles overlap where sites are close together, making them hard to read

    max 2; 1 mark per valid disadvantage.

  2. 1 mark

    It is hard to judge exact values from the size (area) of a circle / similar-sized circles are hard to compare

  3. 1 mark

    Large circles can cover up other features on the map

  4. 1 mark

    They take time to construct, as the radius must be calculated from the square root of each value

Question 3

3 marks

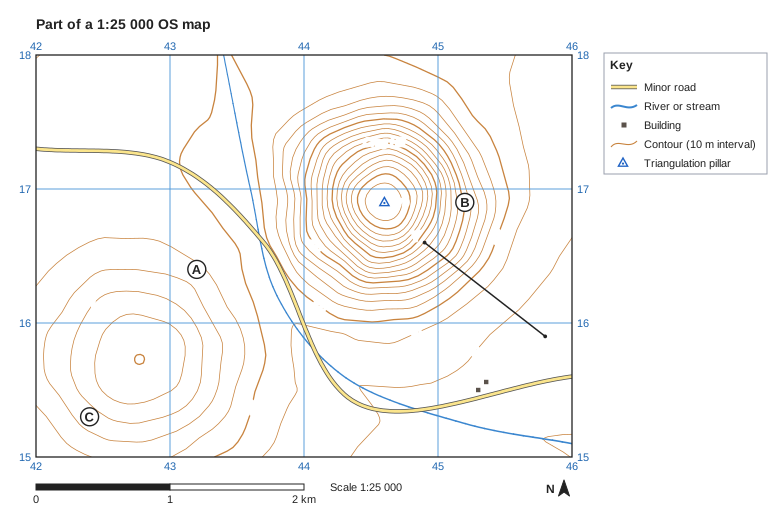
Figure 1 is part of a 1:25 000 OS map. The height of the land at X is 76 m and the height at Y is 189 m.

Calculate the average gradient between X and Y. Give your answer in the form 1 in ...

Part of a 1:25 000 OS map. Ordnance Survey map extract at a scale of 1:25 000. Blue grid lines divide it into 4 by 3 squares, each 1 km across; the eastings 42, 43, 44, 45, 46 are printed along the top and bottom (increasing to the east) and the northings 15, 16, 17, 18 up both sides (increasing to the north). Brown contour lines show the height of the land every 10 m, with every 50 m line drawn thicker; heights printed on contour lines: 80 m, 90 m, 100 m, 150 m. Triangulation pillars (blue triangle) with heights: 270 m in the centre of the map. Water (blue): a stream runs between the north edge and the east edge. Roads and paths: a minor road runs between the west edge and the east edge. Land use: 2 separate buildings (small black squares). Names printed: "Crag Hill" in the north of the map; "Low Moor" in the west of the map; "Beck Fm" in the south-east of the map. Letters in circles mark places: A in the west of the map; B in the east of the map; C in the south-west of the map. A straight line X–Y is drawn from X in the south-east of the map to Y in the east of the map. A key beside the map explains: minor road, river or stream, building, contour (10 m interval), triangulation pillar. Below the map: a scale bar marked 0, 1 and 2 km (1 km is the width of one grid square) and a north arrow pointing to the top of the map.

Model answer

Height difference = 189 − 76 = 113 m. The distance from X to Y measured with the scale is about 1.14 km = 1140 m. Gradient = 113 ÷ 1140, which is 1 in 1140 ÷ 113 = 1 in 10.1, so about 1 in 10.

Explanation

Gradient = vertical height difference ÷ horizontal distance, with both in the same units (metres). Expressed as '1 in x', it means the land rises 1 m for every x metres travelled. Converting the map distance from kilometres to metres is the step most often forgotten.

Mark scheme
  1. 1 mark

    Height difference = 189 − 76 = 113 m

    Correct answer with no working scores full marks.

  2. 1 mark

    Horizontal distance = 1140 m / about 1.1 km

    Accept 1100-1200 m measured with the scale.

  3. 1 mark

    Gradient = 113 ÷ 1140 = 1 in 10 (1 in 10.1)

    Accept 1 in 9.5 to 1 in 11; allow follow-through from the student's measured distance if the method is correct.

Question 4

6 marks

Assess the usefulness of GIS (geographical information systems) and satellite images for managing the risk of river flooding.

Model answer

GIS is very useful for managing flood risk because it allows different layers of information to be combined. For example, a map of land height and the river channel can be overlaid with housing, roads, schools and hospitals, so planners can see exactly which buildings would be flooded if the river reached a certain level. Flood risk maps made this way are used to decide where new houses should not be built, where defences are most needed and which evacuation routes will stay dry.

Satellite images are useful because they cover large areas quickly and can be taken repeatedly. During a flood they show the full extent of the water, helping emergency services target rescues and aid. Images taken over many years can reveal changes in land use, such as urban growth on a flood plain or deforestation upstream, that increase flood risk. Weather satellites also help forecasters warn people of heavy rain in advance.

However, both have limitations. Thick cloud during a storm can block ordinary satellite images, and their resolution may be too coarse to show individual streets. GIS is only as good as the data put into it, which may be out of date or inaccurate, and both need money and specialist skills. Neither shows how local people experience flooding.

Overall, GIS and satellite images are extremely useful for planning and for responding to floods, but they work best alongside ground surveys, river gauges and local knowledge rather than replacing them.

Explanation

An 'assess' question needs specific uses explained in developed chains (data, what it shows, how it reduces risk), limitations, and a supported conclusion. Answers that only list what GIS is, or that ignore limitations, stay in the lower levels.

Mark scheme
  1. 6 marks

    Levels of response (6 marks).
    Level 3 (5-6 marks): Detailed, well-developed explanation of several ways GIS and satellite images can be used to manage flood risk, together with their limitations. Reaches a clear, substantiated judgement about their usefulness.
    Level 2 (3-4 marks): Clear explanation of some uses of GIS and/or satellite images, with some consideration of limitations. A judgement may be made but is only partly supported.
    Level 1 (1-2 marks): Basic statements about GIS or satellite images with little development, few or no limitations and little or no judgement.
    0 marks: nothing worthy of credit.

    Indicative content (not a checklist; credit other valid points): GIS combines layers of data (height, rivers, flood zones, land use, housing, roads, schools and hospitals) so planners can see which buildings and services are at risk; flood risk maps (e.g. the Environment Agency's flood maps) help decide where new housing should not be built (land-use zoning) and where defences are needed; GIS can model the extent of a flood for a given river level and plan evacuation routes and emergency services; satellite images cover large or remote areas quickly and can be repeated, showing the extent of flooding during and after an event, helping target rescue and aid; images over time show land-use change (urbanisation, deforestation) that increases flood risk; weather satellites help forecast heavy rain and give warnings; limitations: cloud cover can block ordinary satellite images during storms (radar can see through cloud), resolution may be too coarse for individual streets, GIS is only as accurate and up to date as its data, costs and expertise needed, they do not show people's experiences, so ground-truthing and local knowledge are still needed; judgement, e.g. very useful for planning and response, but they support rather than replace fieldwork, local data and engineering decisions.

Ready to try the rest? Every answer you write is marked against the mark scheme, so you can see exactly where the marks are.

AI Tutor Hints first, answers after you try

Hi! Stuck? Ask me for a hint and I’ll help you work it out. Once you’ve checked your answer I can explain exactly where the marks are.