Level:
Correct: 0
Incorrect: 0
Marks: 0/0
Exam Practice
Subject:
Topics:
Avg
score:
–
Topics
done:
0/21

Numerical and statistical skills

Practise 30 exam-style questions on Numerical and statistical skills for AQA GCSE Geography (Paper 3). Write your answer as you would in the exam and get it marked in seconds against the mark scheme, point by point, with an AI tutor on hand if you get stuck.

  • 30 questions
  • 1–6 marks each
  • Instant marking
  • No sign-up needed
20 questions, marked as you go

Sample questions with model answers

Here are 4 of the questions in this topic, each with a model answer, an explanation of why it earns the marks and the mark scheme an examiner would use.

Question 1

1 mark

On a 1:50 000 map, the distance between two villages is 4.5 cm.

State the actual distance between the villages in kilometres.

Model answer

4.5 × 50 000 = 225 000 cm = 2.25 km.

Explanation

On a 1:50 000 map, 1 cm represents 50 000 cm, which is 0.5 km, so 2 cm = 1 km. Multiply by the scale, then convert centimetres to kilometres (÷ 100 000).

Mark scheme
  1. 1 mark

    2.25 km

    Accept 2¼ km or 2250 m.

Question 2

2 marks

Explain what is meant by a control site in a fieldwork investigation. Use an example in your answer.

Model answer

A control site is a place that is not affected by the factor being tested but is similar in every other way, so it can be used as a comparison. For example, to see whether trampling reduces vegetation height, a student could measure the vegetation on a footpath and at a control site 10 m away, with the same soil and slope but no trampling.

Explanation

A control shows what conditions would be like without the factor, so any difference can be linked to that factor rather than to other variables. It must be as similar as possible in every other way (soil, slope, aspect, time of day).

Mark scheme
  1. 1 mark

    A site that is not affected by the factor being investigated but is otherwise similar, used as a comparison

  2. 1 mark

    A valid example, e.g. vegetation height measured on a trampled footpath compared with a site a few metres away with the same soil and slope but no trampling / water quality upstream of a sewage outlet compared with downstream

    The example must show the comparison.

Question 3

3 marks

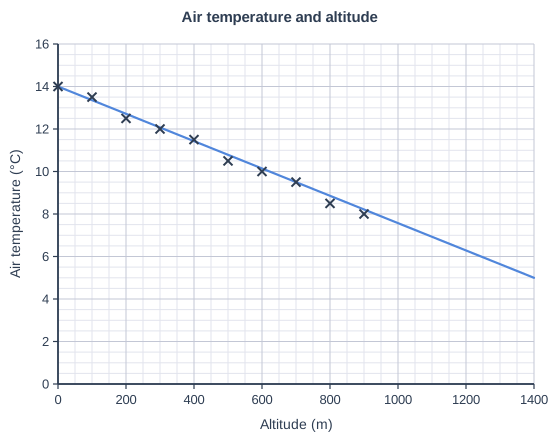
Students measured the air temperature at different altitudes as they walked up a mountain on one day. Figure 1 shows their results with a line of best fit, extended beyond the data.

Use the line of best fit to estimate the temperature at the summit of a nearby mountain, 1300 m high. Explain why this estimate may be unreliable.

Air temperature and altitude. Scatter graph on a grid of small squares. The horizontal axis is "Altitude (m)", from 0 to 1400, numbered every 200, with 4 small squares between numbered values (each small square is 50). The vertical axis is "Air temperature (°C)", from 0 to 16, numbered every 2, with 4 small squares between numbered values (each small square is 0.5). 10 points are plotted as crosses: (0, 14), (100, 13.5), (200, 12.5), (300, 12), (400, 11.5), (500, 10.5), (600, 10), (700, 9.5), (800, 8.5) and (900, 8). A straight line of best fit is drawn; it passes through (0, 14) and (1400, 5).

Model answer

Reading the extended line at 1300 m gives about 5.6 °C. This may be unreliable because it is an extrapolation: the students only measured up to 900 m, so we do not know that the trend continues in the same way above that height. The summit is also on a different mountain and may be more exposed to wind or in cloud, and the readings were taken at different times of day as the students walked up, so the temperatures were also changing over time.

Explanation

Extrapolation extends a trend beyond the range of the data; it assumes conditions stay the same, which may not be true. Good answers name extrapolation and then explain a specific reason why the real value could differ.

Mark scheme
  1. 1 mark

    About 5.6 °C

    Accept 5.4-5.9 °C.

  2. 1 mark

    It is an extrapolation / 1300 m is beyond the range of the data collected (0-900 m)

    max 2 for the explanation: 1 for a reason, 1 for development.

  3. 1 mark

    Development, e.g. the trend may not continue in the same way above 900 m / other factors affect the summit (wind exposure, cloud, aspect, a different mountain) / the data were collected on one day and the temperature changed as the day went on while the students walked up

    development of the previous point; accept any valid development that explains why the estimate may be wrong.

Question 4

6 marks

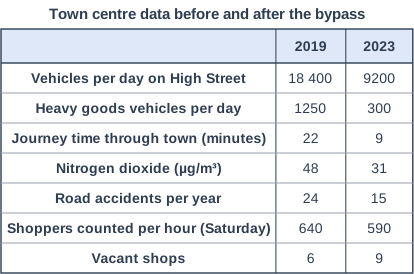
A bypass opened around a market town in 2021 to take through traffic out of the town centre. Figure 1 shows data collected in the town centre in 2019 and in 2023.

Using the data in Figure 1, assess how successful the bypass has been. Use percentage changes in your answer.

Town centre data before and after the bypass. Table with columns "", "2019", "2023". : Vehicles per day on High Street; 2019: 18 400; 2023: 9200 | : Heavy goods vehicles per day; 2019: 1250; 2023: 300 | : Journey time through town (minutes); 2019: 22; 2023: 9 | : Nitrogen dioxide (µg/m³); 2019: 48; 2023: 31 | : Road accidents per year; 2019: 24; 2023: 15 | : Shoppers counted per hour (Saturday); 2019: 640; 2023: 590 | : Vacant shops; 2019: 6; 2023: 9.

Model answer

In terms of its main aim, the bypass has been very successful. Vehicles in the town centre fell from 18 400 to 9200 a day, a 50% decrease, and heavy goods vehicles fell by 76%, from 1250 to 300 a day. This has cut the average journey time through the town from 22 to 9 minutes, a fall of about 59%. There have been environmental and safety benefits too: nitrogen dioxide fell by about 35% (from 48 to 31 µg/m³), which should improve people's health, and accidents fell by 37.5%, from 24 to 15 a year.

However, not all the changes are positive. The number of shoppers counted per hour fell by about 8% (from 640 to 590) and the number of vacant shops rose by 50%, from 6 to 9. This suggests some businesses may have lost passing trade from drivers who now go round the town.

The data have limitations. There are only two years of data, the shopper count may have been taken on just one day, and the decline in shops could be due to other causes such as the growth of online shopping. The table also says nothing about the bypass's own impacts, such as noise or the loss of farmland. Overall, the bypass has been largely successful, because the large falls in traffic, pollution and accidents outweigh the smaller decline in shoppers, but the council may need to support town-centre businesses.

Explanation

An 'assess' question needs a judgement backed by evidence. Calculating percentage changes lets you compare indicators of very different sizes (vehicles, minutes, µg/m³). Strong answers weigh the successes against the costs and recognise what the data cannot tell us.

Mark scheme
  1. 6 marks

    Levels of response (6 marks).
    Level 3 (5-6 marks): Thorough assessment that uses accurate percentage changes from Figure 1 for several indicators, considers both successes and problems (e.g. traffic and pollution compared with shoppers and vacant shops), and reaches a clear, substantiated judgement. May recognise the limitations of the data.
    Level 2 (3-4 marks): Clear assessment with some accurate use of data or percentage changes, but may be unbalanced (mainly successes) or the judgement is only partly supported.
    Level 1 (1-2 marks): Basic statements about the changes with little or no accurate use of data and little or no judgement.
    0 marks: nothing worthy of credit.

    Indicative content (not a checklist; credit other valid points): vehicles per day fell from 18 400 to 9200, a 50% decrease; HGVs fell from 1250 to 300, a 76% decrease - the largest change; journey time fell from 22 to 9 minutes (about 59%); nitrogen dioxide fell from 48 to 31 µg/m³ (about 35%), improving air quality and health; accidents fell from 24 to 15 a year (37.5%), so the centre is safer; however, shoppers per hour fell from 640 to 590 (about 8%) and vacant shops rose from 6 to 9 (a 50% increase), suggesting some businesses lost passing trade; overall the bypass met its main aim of reducing through traffic and its impacts; limitations: only two years of data, a single count of shoppers, other causes (e.g. online shopping, the economy, the pandemic) may explain the decline in shops; no data on the bypass's own impacts (noise, loss of farmland or habitats); judgement, e.g. largely successful for traffic, safety and the environment, less so for the town's economy.

Ready to try the rest? Every answer you write is marked against the mark scheme, so you can see exactly where the marks are.

AI Tutor Hints first, answers after you try

Hi! Stuck? Ask me for a hint and I’ll help you work it out. Once you’ve checked your answer I can explain exactly where the marks are.