Level:
Correct: 0
Incorrect: 0
Marks: 0/0
Exam Practice
Subject:
Topics:
Avg
score:
–
Topics
done:
0/21

Issue: a high-speed rail link

Practise 22 exam-style questions on Issue: a high-speed rail link for AQA GCSE Geography (Paper 3). Write your answer as you would in the exam and get it marked in seconds against the mark scheme, point by point, with an AI tutor on hand if you get stuck.

  • 22 questions
  • 1–12 marks each
  • Instant marking
  • No sign-up needed
20 questions, marked as you go

Sample questions with model answers

Here are 4 of the questions in this topic, each with a model answer, an explanation of why it earns the marks and the mark scheme an examiner would use.

Question 1

1 mark

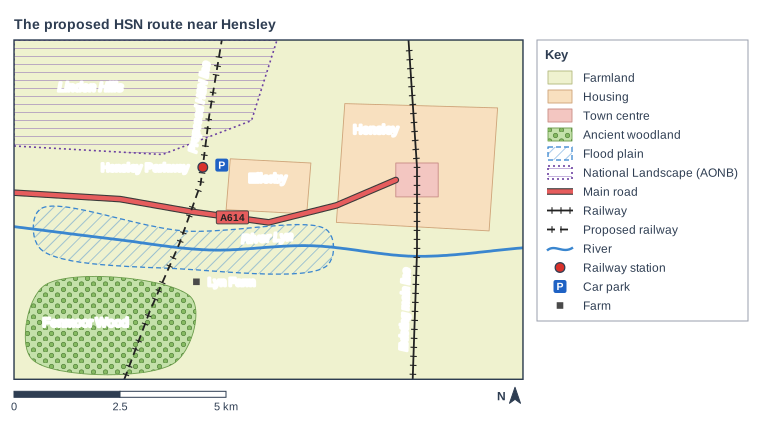
Figure 1 is a map of part of the proposed route of HSN, a new high-speed railway, near the town of Hensley in the Midlands. A new station, Hensley Parkway, would be built on the line.

Use the scale to measure the straight-line distance from Hensley Parkway station to the centre of Hensley (the town centre area).

The proposed HSN route near Hensley. Map of a local area, 12 km from west to east and 8 km from south to north, with north at the top. Areas: the farmland shown pale yellow-green, covering the whole map; "Hensley" (housing area) shown pale orange, in the east of the map; the town centre shown pink, in the east of the map; "Ellerby" (housing area) shown pale orange, in the centre of the map; "Fenmoor Wood" (ancient woodland) shown green with tree symbols, in the south-west of the map; the flood plain shown blue diagonal hatching with a dashed blue outline, in the west of the map; "Linden Hills" (National Landscape (AONB)) shown purple hatching with a dotted purple outline, in the north-west of the map. Lines: the River Lyn (a river, blue, named) runs from the west edge to the east edge, passing through the centre of the map; the A614 (main road) runs from the west edge to the east of the map, passing through the centre of the map; a railway ("Existing main line") runs from the south edge to the north edge, passing through the east of the map; a proposed railway (dashed) ("Proposed HSN line") runs from the south edge to the north edge, passing through the centre of the map. Symbols: the railway station "Hensley Parkway" in the centre of the map (inside the farmland; on the railway; 450 m west of the car park); the car park in the centre of the map (inside the farmland; beside the railway; 450 m east of the railway station "Hensley Parkway"); the farm "Lyn Farm" in the south of the map (inside the farmland). The key (beside the map) shows: farmland, housing, town centre, ancient woodland, flood plain, National Landscape (AONB), main road, railway, proposed railway, river, railway station, P = car park, farm. Below the map: a scale bar marked 0, 2.5 and 5 km and a north arrow pointing to the top.

Model answer

About 5 km (Hensley Parkway station is about 5 km west of Hensley town centre).

Explanation

Mark the distance between the station symbol and the middle of the pink town centre on the edge of a piece of paper, then lay it along the scale bar (0, 2.5 and 5 km). The answer also shows why it is called a 'parkway' station: it is in the countryside, so most passengers would have to drive or take a bus to reach it.

Mark scheme
  1. 1 mark

    About 5 km (accept 4.5-5.5 km)

    the station is at the Hensley Parkway symbol on the proposed line (map position 4.45 km east, 5.0 km north); the town centre is the pink area in Hensley (9.0-10.0 km east, 4.3-5.1 km north), about 4.6 km from the station to its west edge and 5.1 km to its middle; a unit is needed (accept 4500-5500 m)

Question 2

3 marks

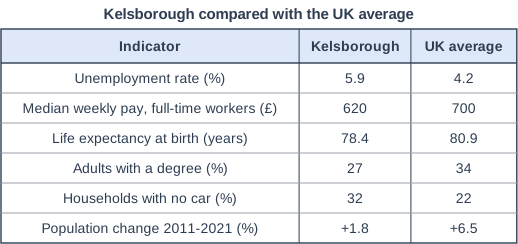
Kelsborough is a city of about 600 000 people in the north of England. It would be at the northern end of HSN, a proposed high-speed railway from London. Figure 1 compares Kelsborough with the UK average.

Using Figure 1, give three pieces of evidence that Kelsborough is less prosperous than the UK average.

Kelsborough compared with the UK average. Table with columns "Indicator", "Kelsborough", "UK average". Indicator: Unemployment rate (%); Kelsborough: 5.9; UK average: 4.2 | Indicator: Median weekly pay, full-time workers (£); Kelsborough: 620; UK average: 700 | Indicator: Life expectancy at birth (years); Kelsborough: 78.4; UK average: 80.9 | Indicator: Adults with a degree (%); Kelsborough: 27; UK average: 34 | Indicator: Households with no car (%); Kelsborough: 32; UK average: 22 | Indicator: Population change 2011-2021 (%); Kelsborough: +1.8; UK average: +6.5.

Model answer

Unemployment in Kelsborough is 5.9%, higher than the UK average of 4.2%. Median weekly pay for full-time workers is £620, which is £80 less than the UK average of £700. Life expectancy is 78.4 years, 2.5 years shorter than the UK average of 80.9 years.

Explanation

Each mark needs a different indicator, and each must compare Kelsborough with the UK average - quoting both figures, or the difference, is the safest way. These differences are typical of the north-south divide, where many northern cities have lower incomes, poorer health and higher unemployment than the south-east.

Mark scheme
  1. 1 mark

    Higher unemployment: 5.9% compared with 4.2% (1.7 percentage points higher)

    max 3; 1 mark per indicator; each piece of evidence must compare Kelsborough with the UK average, using data or a clear comparative statement

  2. 1 mark

    Lower pay: median full-time weekly pay of £620 compared with £700 (£80 a week less)

  3. 1 mark

    Lower life expectancy: 78.4 years compared with 80.9 years (2.5 years shorter)

  4. 1 mark

    Fewer adults with a degree: 27% compared with 34%

  5. 1 mark

    More households with no car: 32% compared with 22%

  6. 1 mark

    Slower population growth: +1.8% compared with +6.5% (suggesting people move away to find work)

Question 3

4 marks

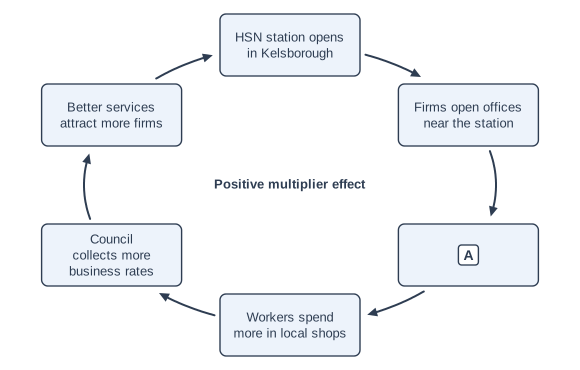
Figure 1 shows how a new HSN high-speed rail station in Kelsborough, a city in the north of England, could affect the city's economy. One step in the cycle has been replaced by the letter A.

Using Figure 1 and your own knowledge, explain how the new station could benefit the economy of Kelsborough.

Cycle diagram. A cycle diagram: 6 boxes arranged in a ring, joined by curved arrows that go clockwise from each box to the next, and from the last box back to the first, so the sequence repeats. Starting with the box at the top and going clockwise, the steps are: 1. "HSN station opens in Kelsborough"; 2. "Firms open offices near the station"; 3. a box with the letter A; 4. "Workers spend more in local shops"; 5. "Council collects more business rates"; 6. "Better services attract more firms"; then back to step 1. "Positive multiplier effect" is printed in the middle of the ring of boxes.

Model answer

When the HSN station opens, Kelsborough will be much closer to London in journey time, so firms will be attracted to open offices near the station, where land is cheaper than in the south. These offices create more jobs for local people (step A), so unemployment falls and incomes rise. Workers spend their wages in local shops, cafes and services, which then employ more people. The council collects more business rates, which it can spend on better services and infrastructure, such as improving the area around the station; this makes the city more attractive and brings in even more firms, so the cycle continues. Building the station would also create construction jobs, and run-down land around it could be regenerated with new offices, homes and hotels.

Explanation

This is a positive multiplier effect: each step causes the next, so the benefits grow over time. Level 2 answers explain the links (why firms come, why spending creates more jobs) and add their own ideas such as regeneration, rather than just copying the boxes. Step A is the jobs that firms create.

Mark scheme
  1. 4 marks

    Levels of response (4 marks).
    Level 2 (3-4 marks): Clear explanation of a linked chain of economic benefits (a positive multiplier effect), including what step A would be (more jobs for local people). Develops Figure 1 with own knowledge, e.g. regeneration of land around the station, construction jobs, more visitors, higher incomes. Accurate use of terms such as investment and multiplier effect.
    Level 1 (1-2 marks): Basic, mostly repeats the steps in Figure 1 with little explanation or linking; may not identify step A.
    0 marks: nothing worthy of credit.

    Indicative content (not a checklist; credit other valid points): step A = more jobs for local people / unemployment falls; firms attracted by fast links to London and by cheaper land and rents than in the south; construction jobs while the station and line are built; regeneration of run-down or brownfield land around the station (offices, homes, hotels); more business visitors and tourists spending in hotels, restaurants and shops; workers' wages are spent locally, supporting more jobs (multiplier); the council collects more business rates and can improve services and infrastructure, which attracts more firms (cumulative causation); improved image of the city; credit the limitation that some new jobs may go to people commuting from elsewhere.

Question 4

9 marks

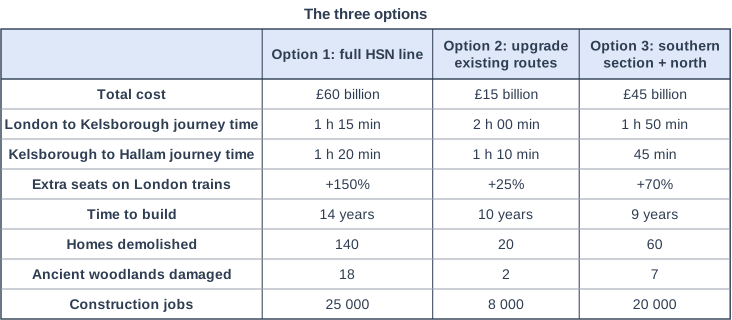
The UK government must decide how to improve transport between London and Kelsborough, a city in the north of England. Option 1 is to build HSN, a full high-speed line (£60 billion). Option 2 is to upgrade the existing main line and roads (£15 billion). Option 3 is to build only the southern section of HSN, from London to Hensley Parkway in the Midlands (£25 billion), and spend £20 billion of the money saved on transport in the north: a tram network in Kelsborough and faster, more frequent trains between northern cities such as Kelsborough and Hallam. Figure 1 compares the three options.

Evaluate Option 3.

The three options. Table with columns "", "Option 1: full HSN line", "Option 2: upgrade existing routes", "Option 3: southern section + north". : Total cost; Option 1: full HSN line: £60 billion; Option 2: upgrade existing routes: £15 billion; Option 3: southern section + north: £45 billion | : London to Kelsborough journey time; Option 1: full HSN line: 1 h 15 min; Option 2: upgrade existing routes: 2 h 00 min; Option 3: southern section + north: 1 h 50 min | : Kelsborough to Hallam journey time; Option 1: full HSN line: 1 h 20 min; Option 2: upgrade existing routes: 1 h 10 min; Option 3: southern section + north: 45 min | : Extra seats on London trains; Option 1: full HSN line: +150%; Option 2: upgrade existing routes: +25%; Option 3: southern section + north: +70% | : Time to build; Option 1: full HSN line: 14 years; Option 2: upgrade existing routes: 10 years; Option 3: southern section + north: 9 years | : Homes demolished; Option 1: full HSN line: 140; Option 2: upgrade existing routes: 20; Option 3: southern section + north: 60 | : Ancient woodlands damaged; Option 1: full HSN line: 18; Option 2: upgrade existing routes: 2; Option 3: southern section + north: 7 | : Construction jobs; Option 1: full HSN line: 25 000; Option 2: upgrade existing routes: 8 000; Option 3: southern section + north: 20 000.

Model answer

Option 3 is a compromise between the other two options. Its main strength is that it spreads the benefits more widely across the north. The £20 billion spent on northern transport would cut the journey from Kelsborough to Hallam from 1 h 20 min to 45 min and build a tram network in Kelsborough. This matters because most people in the north travel locally rather than to London, and many households in Kelsborough do not have a car, so they rely on public transport to reach jobs. Linking northern cities together creates a larger labour market, which could attract firms and help to reduce the north-south divide in a way that benefits ordinary commuters, not just business travellers.

Option 3 still improves links with London. The southern section would cut the journey to 1 h 50 min and add 70% more seats on London trains, relieving overcrowding on the busiest part of the main line. It is the quickest option to build (9 years, compared with 14 for Option 1), so the benefits would arrive sooner, and it would create 20 000 construction jobs, not far below the 25 000 for Option 1.

Environmentally, it is better than Option 1. It damages 7 ancient woodlands rather than 18 and demolishes 60 homes rather than 140, and it avoids building through the Linden Hills north of Hensley Parkway. New trams could also reduce car use and air pollution in Kelsborough. However, the southern section would still cut through countryside and woodland near Hensley, so farmers there would still lose land, and it is far more damaging than Option 2, which affects only 2 ancient woodlands and 20 homes.

The main weakness is that the north would not get the full high-speed link. Kelsborough would remain 1 h 50 min from London, only 30 minutes faster than today, so it may attract less investment from London-based firms than Option 1, which would cut the journey to 1 h 15 min. There is a risk that the south and the Midlands gain most from the high-speed section, which could even widen the divide. It also costs £45 billion, three times as much as Option 2.

Overall, I think Option 3 is a good choice because it balances faster links to London with much better travel within the north, at a lower financial and environmental cost than Option 1. Its success depends on the £20 billion really being spent in the north, but because the line could be extended northwards later if demand grows, I judge it to be the most balanced of the three options.

Explanation

'Evaluate' means weighing up strengths and weaknesses and reaching a judgement. Level 3 answers compare Option 3 with the alternatives using the data (journey times, seats, cost, woodlands, homes) and think about who gains: travellers to London or people making daily journeys within the north. Any judgement can score full marks if it is well supported.

Mark scheme
  1. 9 marks

    Levels of response (9 marks).
    Level 3 (7-9 marks): Thorough evaluation of the strengths and weaknesses of Option 3, considering social, economic and environmental impacts in the short and long term. Detailed use of evidence from Figure 1 and own knowledge. Compares Option 3 with the other options and considers different stakeholders or scales (e.g. London links versus travel within the north). Reaches a clear, substantiated judgement.
    Level 2 (4-6 marks): Clear evaluation with some strengths and weaknesses, but it may be unbalanced or lack comparison with the other options. Some use of Figure 1. A judgement is made but is simple or weakly supported.
    Level 1 (1-3 marks): Basic, simple statements about Option 3, mostly descriptive or one-sided. Little use of Figure 1. No judgement.
    0 marks: nothing worthy of credit.

    Indicative content (not a checklist; credit other valid points): strengths - Kelsborough to Hallam cut from 1 h 20 min to 45 min, the biggest improvement for travel within the north; a tram network helps the many households without cars and reduces congestion and air pollution; links between northern cities create a larger labour market; benefits more people in their daily journeys; still adds 70% more seats on London trains, relieving crowding on the busiest southern section; London journey cut to 1 h 50 min; quickest to build (9 years), so benefits come sooner; 20 000 construction jobs; £15 billion cheaper than Option 1; fewer homes demolished (60) and fewer ancient woodlands damaged (7) than Option 1, and the Linden Hills north of Hensley Parkway would be avoided; weaknesses - the London journey is only 30 minutes faster, so it may attract less investment than Option 1's 1 h 15 min; the high-speed section benefits the south and Midlands most, so the north-south divide may not narrow; still costs three times as much as Option 2 and damages more woodland and homes than Option 2; the southern section still cuts through countryside near Hensley; a risk that the northern money is never spent or that the line is never extended; judgement, e.g. the most balanced option, or a compromise that does neither job fully.

Ready to try the rest? Every answer you write is marked against the mark scheme, so you can see exactly where the marks are.

AI Tutor Hints first, answers after you try

Hi! Stuck? Ask me for a hint and I’ll help you work it out. Once you’ve checked your answer I can explain exactly where the marks are.