Practise 34 exam-style questions on Fieldwork: collecting primary and secondary data for AQA GCSE Geography (Paper 3). Write your answer as you would in the exam and get it marked in seconds against the mark scheme, point by point, with an AI tutor on hand if you get stuck.
34 questions
1–12 marks each
Instant marking
No sign-up needed
20 questions, marked as you go
Sample questions with model answers
Here are 4 of the questions in this topic, each with a model answer, an explanation of why it earns the marks and the mark scheme an examiner would use.
Question 1
1 mark
Which one of the following is qualitative data?
A A river velocity of 0.4 m/s B The number of cars passing in 10 minutes C Shoppers' descriptions of why they like the town centre D The percentage of a quadrat covered by marram grass
Give the letter of your answer.
Model answer
C - shoppers' descriptions of why they like the town centre.
Explanation
Qualitative data is descriptive and non-numerical, such as opinions, interviews, field sketches and photographs. The velocity, traffic count and percentage cover are all numbers, so they are quantitative data.
Mark scheme
1 mark
C (Shoppers' descriptions of why they like the town centre)
accept the letter or the option written out; do not accept more than one answer
Question 2
2 marks
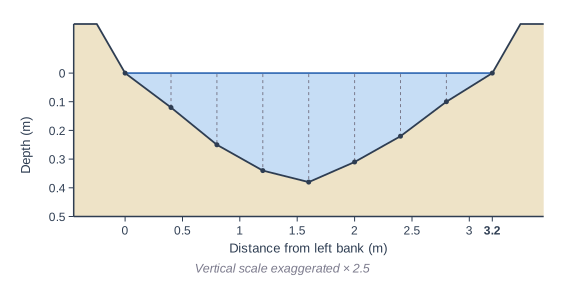
Figure 1 shows the depth of a river measured at 0.4 m intervals across the channel.
Explain why the students measured the depth at regular intervals across the river rather than only once in the middle.
Model answer
The depth of the river changes across the channel - it is 0 m at the edges and 0.38 m at its deepest near the middle. Taking readings at regular intervals gives an accurate mean depth and cross-sectional area, whereas one reading in the middle would overestimate the depth.
Explanation
River channels are not rectangular, so one depth reading cannot represent the whole channel. Evenly spaced readings show the real shape of the bed and allow the mean depth and cross-sectional area to be calculated accurately.
Mark scheme
1 mark
The depth varies across the channel (shallow near the banks, deepest near the middle / 0 m at the edges and 0.38 m at the deepest point)
max 2
1 mark
so several readings give an accurate mean depth / cross-sectional area (and so discharge)
development of the previous point
1 mark
A single reading in the middle would overestimate the mean depth / regular intervals avoid choosing readings in a biased way
Question 3
4 marks
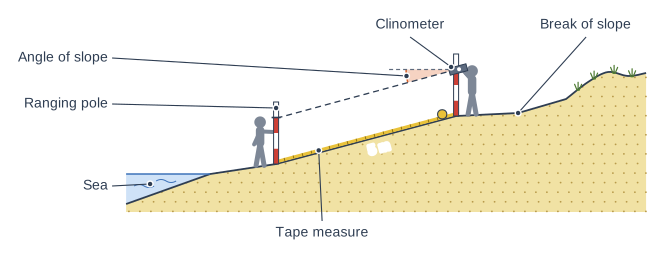
Figure 1 shows the equipment used to measure a beach profile.
Using Figure 1, describe how students could measure a beach profile.
Model answer
Starting at the water's edge, two students hold ranging poles upright at the first break of slope, one nearer the sea and one further up the beach. They measure the distance between the bases of the poles with a tape measure. The student at the upper pole holds a clinometer against it at a marked height and sights to the same height on the lower pole to read the angle of slope. They record the distance and angle, then move the poles up the beach to the next break of slope and repeat until they reach the dunes at the back of the beach.
Explanation
A beach profile is built from a series of distance and angle readings taken between breaks of slope from the sea to the back of the beach. Good answers name the equipment, say what each measures and describe the steps in order.
Mark scheme
1 mark
Start at the water's edge (sea) and place ranging poles at breaks of slope (or at regular intervals) up the beach
max 4; 1 mark per valid step, in a sensible order
1 mark
Measure the distance between the two poles along the beach with the tape measure
1 mark
Measure the angle of slope with a clinometer, sighting from one pole to the same height on the other pole
1 mark
Record the distance and angle, then move the poles up the beach and repeat until the back of the beach (e.g. the dunes) is reached
1 mark
Repeat the profile at other points along the beach / plot the readings to draw the profile to scale
Question 4
6 marks
Students want to find out whether the regeneration of the seafront in Seabrook, a seaside town, has improved its environmental quality and attracted more visitors.
Justify two primary data collection methods that the students could use.
Model answer
The first method is an environmental quality survey. At sites every 100 m along the regenerated seafront, and at the same number of sites in an older part of the town that has not been regenerated, students would score features such as litter, noise, green space and the condition of buildings from -3 to +3. This is justified because it turns environmental quality into numbers, so the regenerated and non-regenerated areas can be compared directly. To reduce subjectivity, two students should score each site and take the mean.
The second method is a questionnaire of visitors and residents on the seafront. Using systematic sampling, such as asking every tenth person who passes, students would ask how often people visit, whether they come more often since the regeneration and how they rate the seafront on a scale of 1 to 5. This is justified because whether the area has 'improved' and attracts more visitors depends on people's experiences, which only they can report. Carrying out the survey on a weekday and at the weekend would make the results more representative.
Explanation
'Justify' means explaining why each method suits the question, not just describing it. Level 3 answers say exactly how and where each method would be carried out and link the data it produces to environmental quality or visitor numbers.
Mark scheme
6 marks
Levels of response (6 marks). Level 3 (5-6 marks): Two appropriate primary methods, each described in detail (equipment, sampling, how and where) and clearly justified by explaining how the data would help to answer the question. Shows awareness of the methods' limitations or how to make them reliable. Level 2 (3-4 marks): Two appropriate methods with some description and justification, or one method well described and justified. Level 1 (1-2 marks): Basic identification of one or two methods with little description or justification. 0 marks: nothing worthy of credit.
Indicative content (not a checklist; credit other valid points): environmental quality (bipolar) survey at sites on the regenerated seafront and in a nearby area that has not been regenerated, scoring litter, noise, green space, building condition, so the two can be compared; pedestrian counts at the same sites and times to show visitor numbers; questionnaires or interviews with visitors and residents about how often they visit and whether the area has improved; interviews with business owners about trade since regeneration; land-use survey of seafront buildings (empty shops, cafes, hotels); field sketches or photographs, compared with old (secondary) photographs to show change; justification - each method should be linked to environmental quality or visitor numbers; sampling, e.g. systematic sites along the seafront, comparison sites; reliability - repeat at different times and days, several surveyors; primary methods only (secondary data does not answer this question).
Ready to try the rest? Every answer you write is marked against the mark scheme, so you can see exactly where the marks are.
Ctrl + Enter to check
AI TutorHints first, answers after you try
Hi! Stuck? Ask me for a hint and I’ll help you work it out. Once you’ve checked your answer I can explain exactly where the marks are.