Level:
Correct: 0
Incorrect: 0
Marks: 0/0
Exam Practice
Subject:
Topics:
Avg
score:
–
Topics
done:
0/21

Issue: flood defences for a market town

Practise 23 exam-style questions on Issue: flood defences for a market town for AQA GCSE Geography (Paper 3). Write your answer as you would in the exam and get it marked in seconds against the mark scheme, point by point, with an AI tutor on hand if you get stuck.

  • 23 questions
  • 1–12 marks each
  • Instant marking
  • No sign-up needed
20 questions, marked as you go

Sample questions with model answers

Here are 4 of the questions in this topic, each with a model answer, an explanation of why it earns the marks and the mark scheme an examiner would use.

Question 1

1 mark

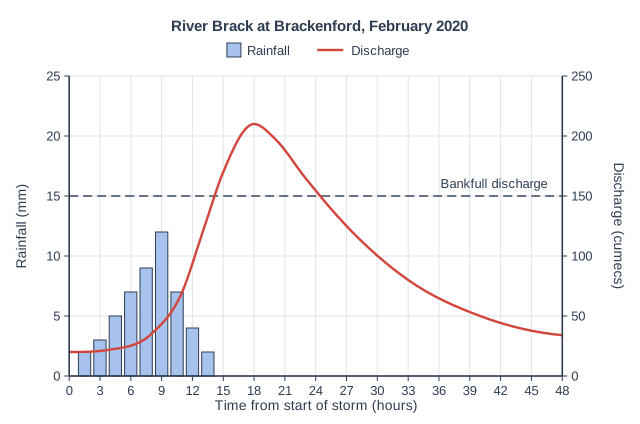
Figure 1 is a storm hydrograph for the River Brack at Brackenford, a market town in northern England, during a flood in February 2020.

State the peak discharge of the River Brack shown in Figure 1.

River Brack at Brackenford, February 2020. Storm hydrograph. Rainfall is drawn as blue bars rising from the time axis, read on the left axis (Rainfall in mm, 0 to 25, numbered every 5); river discharge is drawn as a smooth red curve, read on the right axis ("Discharge (cumecs)", 0 to 250, numbered every 50). Time is "Time from start of storm (hours)" along the bottom, 0 to 48, numbered every 3. A key shows Rainfall (bars) and Discharge (solid red line). Rainfall bars (centred on their times): 1.5 h 2 mm, 3 h 3 mm, 4.5 h 5 mm, 6 h 7 mm, 7.5 h 9 mm, 9 h 12 mm, 10.5 h 7 mm, 12 h 4 mm, 13.5 h 2 mm. Discharge (a smooth curve through these points): 0 h 20, 4 h 22, 8 h 35, 11 h 70, 13 h 120, 15 h 170, 18 h 210, 20 h 198, 23 h 165, 27 h 125, 33 h 80, 40 h 50, 48 h 34 cumecs. The label "Bankfull discharge" sits on a horizontal dashed line (long dashes) across the graph at 150 cumecs.

Model answer

210 cumecs

Explanation

The peak discharge is the highest point on the discharge curve, read on the right-hand (discharge) axis, not the left-hand rainfall axis. Here it is about 210 cumecs, well above the bankfull discharge of 150 cumecs, which is why the town flooded.

Mark scheme
  1. 1 mark

    210 cumecs (m³/s)

    Accept 205-215 cumecs. Units not required.

Question 2

2 marks

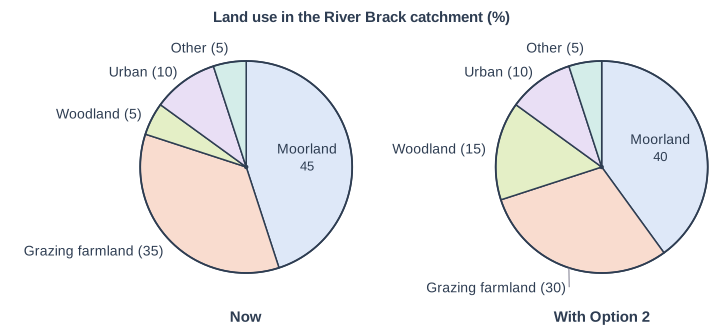
Option 2 for reducing flood risk in Brackenford, a market town in northern England, includes planting trees in the River Brack catchment. Figure 1 shows land use in the catchment now and with Option 2.

Use Figure 1 to describe how land use in the catchment would change with Option 2.

Land use in the River Brack catchment (%). Two pie charts side by side, labelled "Now" (left) and "With Option 2" (right). "Now": A circle divided into sectors, drawn clockwise from the top (12 o'clock): Moorland (45 printed in it), 162°; Grazing farmland (35 printed in it), 126°; Woodland (5 printed in it), 18°; Urban (10 printed in it), 36°; Other (5 printed in it), 18°. (Angles are not printed on the chart; these are the drawn sizes, which can be measured with a protractor.) "With Option 2": A circle divided into sectors, drawn clockwise from the top (12 o'clock): Moorland (40 printed in it), 144°; Grazing farmland (30 printed in it), 108°; Woodland (15 printed in it), 54°; Urban (10 printed in it), 36°; Other (5 printed in it), 18°. (Angles are not printed on the chart; these are the drawn sizes, which can be measured with a protractor.)

Model answer

Woodland would triple from 5% to 15% of the catchment. This land would come from moorland, which would fall from 45% to 40%, and grazing farmland, which would fall from 35% to 30%, while urban land would stay at 10%.

Explanation

'Describe' with 'use Figure 1' needs the changes with data from both pie charts. Percentage-point changes (from 5% to 15%) are clearer than vague words such as 'more trees'.

Mark scheme
  1. 1 mark

    Woodland would increase from 5% to 15% (it would triple / increase by 10 percentage points)

    max 2; data must be accurate. Max 1 for a description with no data.

  2. 1 mark

    Moorland would fall from 45% to 40% and grazing farmland from 35% to 30% (each falls by 5 percentage points)

    Accept either moorland or farmland with correct data.

  3. 1 mark

    Urban land (10%) and other land (5%) would stay the same

Question 3

4 marks

Option 1 for Brackenford, a market town on the River Brack, is to build raised embankments and flood walls along 2.4 km of the river through the town. The village of Lowthorpe lies on the River Brack about 2 km downstream of Brackenford.

Suggest why people living in Lowthorpe might oppose Option 1.

Model answer

At the moment, when the River Brack floods, much of the water spreads out over the flood plain in Brackenford and is stored there for a while. With embankments and walls, this water would be kept in the channel and passed straight through the town. A larger volume of water would therefore arrive at Lowthorpe, and it would arrive more quickly, so the peak discharge there would be higher and the village, which has no defences of its own, would be more likely to flood. People in Lowthorpe may also feel it is unfair that public money protects the town while their flood risk increases, especially as Option 2 would reduce flooding in Lowthorpe too.

Explanation

Hard engineering in one place often moves the problem elsewhere. Level 2 answers explain the mechanism - water no longer stored on the town's flood plain is passed downstream faster - rather than just stating that Lowthorpe will flood.

Mark scheme
  1. 4 marks

    Levels of response (4 marks).
    Level 2 (3-4 marks): clear, developed suggestions explaining how Option 1 could increase flood risk or other problems downstream, with a clear chain of reasoning applied to Lowthorpe.
    Level 1 (1-2 marks): basic suggestions, e.g. 'it would flood them instead', with little explanation.
    0 marks: nothing worthy of credit.

    Indicative content (not a checklist; credit other valid points): at present floodwater spreads out over the flood plain in Brackenford and is stored there; embankments keep the water in the channel, so more water is passed downstream; the water also moves through the town faster in a confined channel; so a larger volume arrives at Lowthorpe more quickly, raising its peak discharge and shortening its lag time; Lowthorpe has no defences, so it is more likely to flood; public money is spent protecting the town but not the village; if the walls were overtopped or breached, a sudden surge could flow downstream; Option 1 does nothing to reduce the amount of water in the river, unlike Option 2, which would reduce flooding in Lowthorpe as well.

Question 4

9 marks

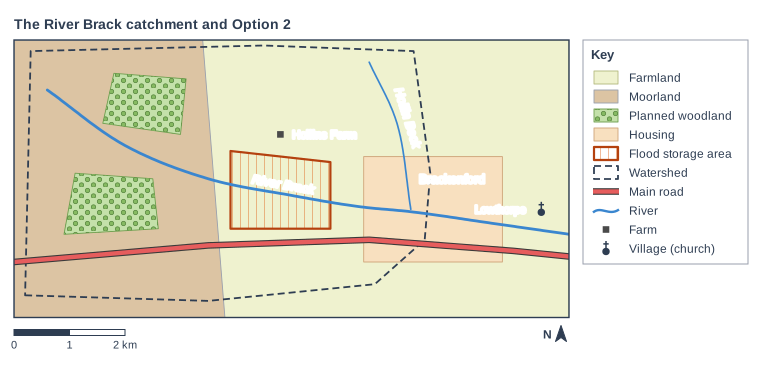
Brackenford is a market town in northern England. Option 1 would build embankments and flood walls along the River Brack through the town (£9 million). Option 2 would build a flood storage area on 200 hectares of farmland about 2 km upstream, plant about 300 hectares of woodland and build leaky dams on moorland streams (£13 million). Figure 1 shows the River Brack catchment and Option 2.

To what extent would Option 2 be more sustainable than Option 1?

The River Brack catchment and Option 2. Map of a local area, 10 km from west to east and 5 km from south to north, with north at the top. Areas: the farmland shown pale yellow-green, covering the whole map; the moorland shown brown, in the west of the map; the planned woodland shown green with tree symbols, in the west of the map; the planned woodland shown green with tree symbols, in the north-west of the map; "Brackenford" (housing area) shown pale orange, in the east of the map; the flood storage area shown orange line shading with a solid orange-brown outline, in the centre of the map; the watershed shown a dashed black outline, in the centre of the map. Lines: the River Brack (a river, blue, named) runs from the north-west of the map to the east edge, passing through the centre of the map; Hollin Beck (a stream, blue, named) runs from the north of the map to the east of the map; a main road runs from the west edge to the east edge, passing through the south of the map. Symbols: the farm "Hollins Farm" in the centre of the map (inside the farmland and the watershed); the village (church) "Lowthorpe" in the east of the map (inside the farmland). The key (beside the map) shows: farmland, moorland, planned woodland, housing, flood storage area, watershed, main road, river, farm, village (church). Below the map: a scale bar marked 0, 1 and 2 km and a north arrow pointing to the top.

Model answer

A sustainable option meets the needs of people today without reducing the ability of future generations to meet theirs, balancing social, economic and environmental needs.

Environmentally, Option 2 is clearly more sustainable. It works with natural processes across the whole catchment. Figure 1 shows planned woodland on the moorland and farmland in the upper catchment; the trees would intercept rain and increase infiltration, reducing runoff, and they would also create habitats, store carbon and reduce soil erosion. The flood storage area could become a wetland habitat. Option 1 relies on concrete and earth walls and brings no environmental benefits.

Option 2 also tackles the cause of flooding - water running off the steep moorland quickly - rather than just holding the water in the channel. This means it reduces flood risk downstream in Lowthorpe as well as in Brackenford, whereas Option 1 would pass more water down to Lowthorpe and increase its risk. As climate change brings wetter winters, storage and slower runoff will keep reducing peak discharge, but walls may have to be raised.

Economically, Option 1 is cheaper: about £11.5 million over 50 years against about £17 million for Option 2. However, Option 2 brings wider benefits that are not counted in these costs, such as carbon storage, wildlife and lower flood risk downstream, and it would not need expensive raising in future.

Socially, Option 2 has weaknesses. It would take about 20 years for the trees to grow and the scheme to work fully, so people in Brackenford would remain at some risk, whereas Option 1 would protect 470 properties within 2 years. Farmers such as the one at Hollins Farm would lose the use of land when the storage area floods and when fields are planted with trees, so fair compensation is needed. Figure 1 also shows that the storage area is only on the River Brack, so floodwater from Hollin Beck, which joins in the town, would not be held back. Similar schemes, such as 'Slowing the Flow' at Pickering, have shown that natural flood management can work, but it takes time.

Overall, Option 2 is more sustainable than Option 1 to a large extent, because it benefits the environment, protects places downstream and copes better with future climate change. It is less sustainable socially in the short term, so combining it with temporary measures such as flood warnings would make it even more sustainable.

Explanation

Level 3 answers define sustainability, compare both options across the social, economic and environmental strands, use the map (where the storage area and woodland are, and what they do not cover) and costs, and reach a judgement on 'to what extent'. Good answers notice that the most sustainable option can still have short-term social costs.

Mark scheme
  1. 9 marks

    Levels of response (9 marks).
    Level 3 (7-9 marks): thorough comparison of the sustainability of Options 1 and 2, weighing social, economic and environmental effects for present and future generations; detailed understanding of how each option works; reaches a clear, substantiated judgement on the extent to which Option 2 is more sustainable; makes effective use of Figure 1 and the information given, with accurate own knowledge.
    Level 2 (4-6 marks): clear discussion of the sustainability of both options, which may be unbalanced or focus on one strand; a judgement that is only partly supported; some use of the resources.
    Level 1 (1-3 marks): basic points about one or both options with little reference to sustainability; little or no use of Figure 1; no clear judgement.
    0 marks: nothing worthy of credit.

    Indicative content (not a checklist; credit other valid points): sustainability means meeting present needs without harming future generations, balancing people, the economy and the environment; Option 2 environmental - works with natural processes across the catchment, woodland and wetlands create habitats, trees store carbon, reduce soil erosion and improve water quality; Option 1 has no environmental benefits and uses concrete; Option 2 reduces flood risk downstream at Lowthorpe as well as in the town, while Option 1 increases it; Option 2 tackles the causes (fast runoff from moorland) rather than the symptoms; Option 2 adapts better to wetter winters because storage and trees reduce peak discharge, whereas walls may need raising; economic - Option 2 costs more (£13 million plus £80 000 a year, about £17 million over 50 years, against £11.5 million) but brings wider benefits (carbon, wildlife, tourism, lower risk downstream); social - Option 2 takes about 20 years to work fully, leaving the town at risk in the meantime; farmers lose the use of land (200 hectares flooded occasionally, land for woodland) and need compensation; Figure 1 shows the storage area lies on the River Brack only, so Hollin Beck, which joins in the town, is not controlled; Option 1 protects 470 properties within 2 years but moves the problem downstream and may encourage building behind walls; own knowledge, e.g. Pickering's 'Slowing the Flow' scheme (leaky dams, tree planting and a storage bund) or the Banbury flood storage area; judgement, e.g. Option 2 is more sustainable to a large extent environmentally and in the long term, but less so socially in the short term.

Ready to try the rest? Every answer you write is marked against the mark scheme, so you can see exactly where the marks are.

AI Tutor Hints first, answers after you try

Hi! Stuck? Ask me for a hint and I’ll help you work it out. Once you’ve checked your answer I can explain exactly where the marks are.