Level:
Correct: 0
Incorrect: 0
Marks: 0/0
Exam Practice
Subject:
Topics:
Avg
score:
–
Topics
done:
0/21

Fieldwork: evaluating the enquiry

Practise 28 exam-style questions on Fieldwork: evaluating the enquiry for AQA GCSE Geography (Paper 3). Write your answer as you would in the exam and get it marked in seconds against the mark scheme, point by point, with an AI tutor on hand if you get stuck.

  • 28 questions
  • 1–12 marks each
  • Instant marking
  • No sign-up needed
20 questions, marked as you go

Sample questions with model answers

Here are 4 of the questions in this topic, each with a model answer, an explanation of why it earns the marks and the mark scheme an examiner would use.

Question 1

1 mark

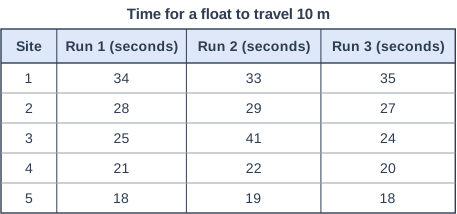
Students timed a float over 10 m three times at each of five sites on a river. Figure 1 shows their results.

Identify the site at which the float times are least reliable.

Time for a float to travel 10 m. Table with columns "Site", "Run 1 (seconds)", "Run 2 (seconds)", "Run 3 (seconds)". Site: 1; Run 1 (seconds): 34; Run 2 (seconds): 33; Run 3 (seconds): 35 | Site: 2; Run 1 (seconds): 28; Run 2 (seconds): 29; Run 3 (seconds): 27 | Site: 3; Run 1 (seconds): 25; Run 2 (seconds): 41; Run 3 (seconds): 24 | Site: 4; Run 1 (seconds): 21; Run 2 (seconds): 22; Run 3 (seconds): 20 | Site: 5; Run 1 (seconds): 18; Run 2 (seconds): 19; Run 3 (seconds): 18.

Model answer

Site 3

Explanation

Reliable repeat readings should be close together. At every other site the three runs differ by no more than 2 seconds, but at Site 3 one run took 41 seconds compared with 24-25 seconds, so the float may have been caught in an eddy or on vegetation and that run should be repeated.

Mark scheme
  1. 1 mark

    Site 3

    the run of 41 seconds is very different from the other two runs (25 and 24 seconds); do not accept more than one site

Question 2

2 marks

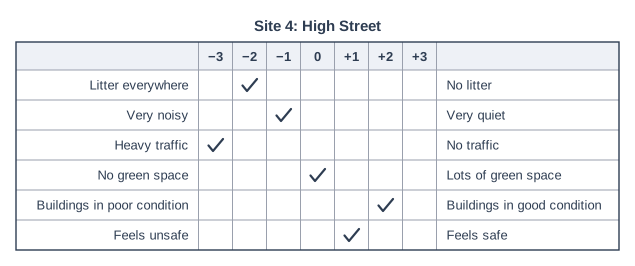
Figure 1 shows a bipolar environmental quality survey completed by one student at a site on High Street.

Suggest why results from surveys like this may be unreliable.

Diagram of a bipolar (environmental quality) survey. Heading: "Site 4: High Street". An environmental quality (bipolar) survey sheet: a table with 6 rows, each with a negative description on the left and the opposite, positive description on the right, and seven score boxes between them headed −3, −2, −1, 0, +1, +2, +3. One box in each row is ticked. Rows from top to bottom: "Litter everywhere" (left) / "No litter" (right): tick under −2; "Very noisy" (left) / "Very quiet" (right): tick under −1; "Heavy traffic" (left) / "No traffic" (right): tick under −3; "No green space" (left) / "Lots of green space" (right): tick under 0; "Buildings in poor condition" (left) / "Buildings in good condition" (right): tick under +2; "Feels unsafe" (left) / "Feels safe" (right): tick under +1. No parts are labelled.

Model answer

The scores are based on the student's own judgement. Another student standing in the same place might think the traffic was only −1 rather than −3, so the totals from different surveyors may not be consistent.

Explanation

Bipolar surveys turn opinions into numbers, which makes them easy to compare but subjective. Reliability can be improved by having several students score each site and taking the mean, and by agreeing clear criteria for each score.

Mark scheme
  1. 1 mark

    The scores are subjective / based on the opinion or judgement of the person doing the survey

    max 2; 1 mark for a reason, 1 for development

  2. 1 mark

    so different students could give different scores at the same site (e.g. one student might score traffic −3 and another −1), and results are not consistent

    development of the previous point

  3. 1 mark

    The scores depend on the time or day of the survey (e.g. litter before or after street cleaning, traffic at rush hour)

    alternative reason

  4. 1 mark

    so repeating the survey at another time could give a very different total

    development of the previous point

  5. 1 mark

    Every category is given equal weight even though some matter more

    alternative reason; development, e.g. 'so the total may not reflect people's real view of the area'

Question 3

4 marks

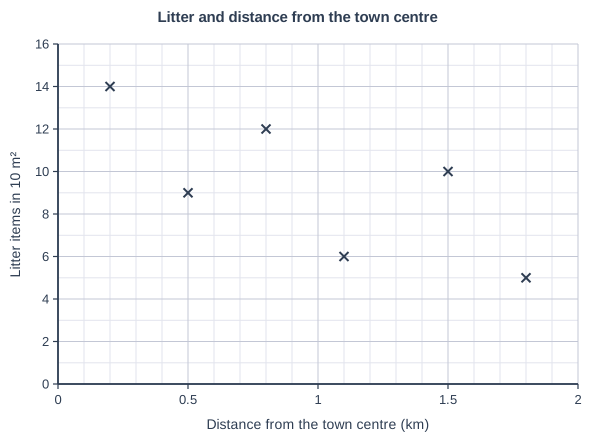
A student tested the hypothesis 'Litter decreases with distance from the town centre'. She counted litter at six sites. Figure 1 shows her results. She concluded: 'My hypothesis is correct.'

Using Figure 1, suggest why her conclusion may not be reliable.

Litter and distance from the town centre. Scatter graph on a grid of small squares. The horizontal axis is "Distance from the town centre (km)", from 0 to 2, numbered every 0.5, with 5 small squares between numbered values (each small square is 0.1). The vertical axis is "Litter items in 10 m²", from 0 to 16, numbered every 2, with 2 small squares between numbered values (each small square is 1). 6 points are plotted as crosses: (0.2, 14), (0.5, 9), (0.8, 12), (1.1, 6), (1.5, 10) and (1.8, 5).

Model answer

Her conclusion is too strong. She used only six sites, so one unusual site has a large effect on the pattern. Although litter is generally lower further from the centre, the points do not fall steadily: the site 0.8 km away had 12 items, more than the site at 0.5 km with 9, and the site at 1.5 km had 10, more than the one at 1.1 km with 6. This is only a moderate negative correlation. Litter was also counted only once, so the results depend on when the streets were last cleaned. She should say that the results partly support the hypothesis.

Explanation

A reliable conclusion needs enough data and a clear pattern. Use the graph to show both the small sample and the inconsistent points, and suggest better wording, such as 'partly supports'.

Mark scheme
  1. 4 marks

    Levels of response (4 marks).
    Level 2 (3-4 marks): Clear explanation of at least two reasons why the conclusion is not reliable, making specific use of Figure 1 (e.g. the small number of sites, the weak or inconsistent pattern).
    Level 1 (1-2 marks): Basic reasons with little or no use of Figure 1.
    0 marks: nothing worthy of credit.

    Indicative content (not a checklist; credit other valid points): only six sites, a very small sample, so one unusual site has a big effect; the correlation is negative but only moderate - the points do not decrease steadily (e.g. 12 items at 0.8 km, more than the 9 at 0.5 km; 10 items at 1.5 km, more than the 6 at 1.1 km); the pattern zig-zags, so it could partly be chance; litter was counted once, so it depends on when bins were emptied or streets cleaned; other factors (bins, takeaways, schools, wind) may matter more than distance; sites stop at 1.8 km, so the conclusion cannot be applied to the whole town; 'correct' is too strong - the results only partly support the hypothesis.

Question 4

6 marks

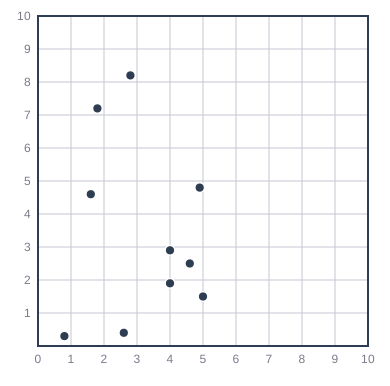
Students wanted to estimate the average vegetation cover on an area of heathland. They divided a 100 m × 100 m study area into a 10 × 10 grid and used random sampling to choose where to place 10 quadrats. Figure 1 shows the sample points they used.

Evaluate this sampling strategy for their enquiry.

Diagram of random sampling in a study area. A square study area drawn as a 10 by 10 grid of squares, numbered 0 to 10 along the bottom and up the left-hand side (coordinates below are given as (across, up) from the bottom left-hand corner). 10 dots are scattered over it in no regular pattern, at (0.8, 0.3), (1.6, 4.6), (1.8, 7.2), (2.6, 0.4), (2.8, 8.2), (4, 1.9), (4, 2.9), (4.6, 2.5), (4.9, 4.8) and (5, 1.5). No parts are labelled.

Model answer

Random sampling has a clear strength: the students did not choose where to put the quadrats, so there is no bias from, for example, picking places that look interesting or are easy to reach. In principle every part of the heath had an equal chance of being sampled.

However, Figure 1 shows the weakness of random sampling with a small sample. All 10 points are in the western half of the area; no quadrat is east of 5 on the grid, so half the heath was not sampled at all. Several points are also clustered together, around 4 across and 2-3 up. If the vegetation in the eastern half is different, for example if there is a path, bracken or wetter ground there, the estimate of average cover will be wrong. Ten quadrats is also a small sample for an area of 10 000 m².

A better strategy would be systematic sampling, such as one quadrat in the middle of every other grid square, which would give even coverage, or simply more random points. If the heath has clear zones, stratified random sampling would make sure each zone is included.

Overall, random sampling is a reasonable choice in principle, but this sample is unrepresentative, so the estimate of vegetation cover is not reliable.

Explanation

Evaluate the strategy both in general (random sampling avoids bias) and as it actually worked out in Figure 1 (all points in one half of the area). Linking the weakness to the effect on the estimate and suggesting a justified alternative lifts an answer to Level 3.

Mark scheme
  1. 6 marks

    Levels of response (6 marks).
    Level 3 (5-6 marks): Detailed evaluation of the strengths and weaknesses of random sampling for this enquiry, making effective use of evidence from Figure 1; may suggest justified alternatives; reaches a clear, substantiated judgement.
    Level 2 (3-4 marks): Clear evaluation of some strengths and/or weaknesses with some use of Figure 1; judgement may be implied.
    Level 1 (1-2 marks): Basic statements about random sampling with little or no use of Figure 1.
    0 marks: nothing worthy of credit.

    Indicative content (not a checklist; credit other valid points): Strengths: random sampling avoids bias, because the students do not choose where to put quadrats; every part of the area has an equal chance of being sampled; points are easy to generate from random number tables or an app. Weaknesses: in Figure 1 all 10 points lie in the western half of the area (no point east of 5 on the grid), so half the heath is not sampled at all; several points are clustered (e.g. around 4-5 across and 1.5-3 up); if vegetation differs across the area (e.g. a path, wetter ground or bracken on one side), the estimate will be biased; 10 quadrats is a small sample for 10 000 m²; random points can be slow to locate on the ground. Alternatives: systematic sampling (e.g. a quadrat at the centre of every other grid square) for even coverage; stratified random sampling if there are different zones; more quadrats. Judgement, e.g. random sampling is a sound choice in principle, but this particular sample is unrepresentative, so the estimate is unreliable.

Ready to try the rest? Every answer you write is marked against the mark scheme, so you can see exactly where the marks are.

AI Tutor Hints first, answers after you try

Hi! Stuck? Ask me for a hint and I’ll help you work it out. Once you’ve checked your answer I can explain exactly where the marks are.