
Level:
Correct: 0
Incorrect: 0
Marks: 0/0
Exam Practice
Course:
Topics:
Edexcel GCSE Physics (Paper 1) Smart practice A mixed round aimed at your weak spots
Unit 1
Key concepts of physics
Unit 2
Motion and forces
Unit 3
Conservation of energy
Unit 4
Waves
Unit 5
Light and the electromagnetic spectrum
Unit 6
Radioactivity
Unit 7
Astronomy
Avg
score:
–
Topics
done:
0/40

Speed and distance-time graphs

Practise 16 exam-style questions on Speed and distance-time graphs for Edexcel GCSE Physics (Paper 1). Write your answer as you would in the exam and get it marked in seconds against the mark scheme, point by point, with the Study Helper on hand if you get stuck.

  • 16 questions
  • 1–6 marks each
  • Instant marking
  • No sign-up needed
16 questions, marked as you go

Sample questions with model answers

Here are 4 of the questions in this topic, each with a model answer, an explanation of why it earns the marks and the mark scheme an examiner would use.

Question 1

1 mark

A hiker records a long walk. She plots a distance-time graph of the walk, with distance in km on the vertical axis and time in hours on the horizontal axis.

What is the unit of the gradient of her graph?

Choose your answer.

  • A km/h
  • B h/km
  • C km h
  • D km/h²

Model answer

A km/h

Explanation

The gradient of a distance-time graph is the change in distance divided by the change in time, so its unit is the vertical-axis unit divided by the horizontal-axis unit: km ÷ h = km/h, which is a unit of speed. Dividing the wrong way round (h/km) or multiplying the units (which would be for an area) are common errors; km/h² would be the unit of the gradient of a velocity-time graph.

Mark scheme
  1. 1 mark

    A / km/h (1)

    The only correct answer is A: the gradient is the change in distance ÷ the change in time, so its unit is the unit on the vertical axis divided by the unit on the horizontal axis, km ÷ h = km/h, a unit of speed. B is not correct because it divides the time by the distance (the wrong way round); C is not correct because multiplying the two units gives the unit of the area under the line, not the gradient; D is not correct because km/h² is a unit of acceleration, the gradient of a velocity-time graph. Accept the letter or the option. If more than one option is given, do not award the mark.
Question 2

2 marks

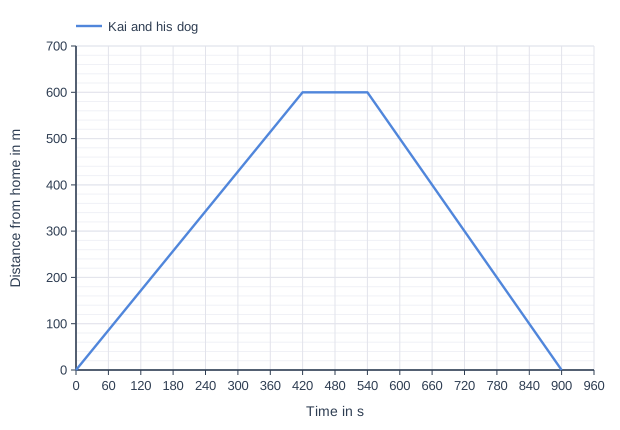
Kai walks his dog from home to a park and back again along the same path.

The graph shows how their distance from home changes with time.

Calculate their speed as they walk back home.

Line graph of distance from home in m (y-axis, 0 to 700) against time in s (x-axis, 0 to 960). "Kai and his dog" joins the points (0, 0), (420, 600), (540, 600), (900, 0).

Model answer

On the way back, the distance from home falls from 600 m to 0 m between 540 s and 900 s.
speed = gradient = 600 ÷ (900 - 540) = 600 ÷ 360 = 1.7 m/s

Explanation

The speed is the gradient of the section of the graph for the walk home: the change in distance divided by the time taken for that section. The line slopes down because the distance from home is decreasing, but the speed is still 1.7 m/s. Using the whole time from the start, or the section for the walk to the park, are common errors.

Mark scheme
  1. 1 mark

    (speed = gradient =) 600 ÷ (900 - 540) / 600 ÷ 360 (1)

    values must be from the section from 540 s to 900 s.

  2. 1 mark

    1.7 (m/s) (1)

    accept values that round to 1.7, e.g. 1.67; accept -1.7 m/s (the gradient is negative because the distance from home decreases); An answer of 1.7 (m/s) with no working scores 2 marks. 1.4 m/s (600 ÷ 420, the speed on the way to the park) scores 0; 0.67 (600 ÷ 900) scores 0.

Question 3

3 marks

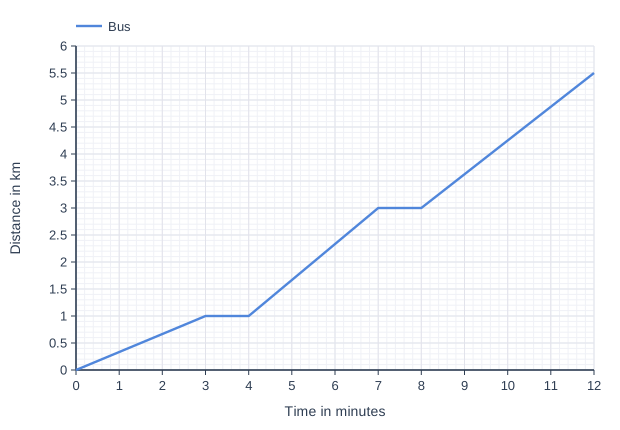
The graph shows the distance travelled by a bus on part of its route. The bus stops twice to pick up passengers.

Determine the greatest speed of the bus, in m/s, during this part of its route.

Line graph of distance in km (y-axis, 0 to 6) against time in minutes (x-axis, 0 to 12). "Bus" joins the points (0, 0), (3, 1), (4, 1), (7, 3), (8, 3), (12, 5.5).

Model answer

The steepest part of the graph is from 4 to 7 minutes.
The bus travels 3.0 - 1.0 = 2.0 km = 2000 m in 3 minutes = 180 s.
greatest speed = 2000 ÷ 180 = 11 m/s

Explanation

The speed is the gradient, so the greatest speed is on the steepest section. The sections from 4 to 7 minutes (2.0 km in 3 minutes) and from 8 to 12 minutes (2.5 km in 4 minutes) look similar, so work out both gradients before choosing. Remember to change km to m and minutes to s to give the speed in m/s.

Mark scheme
  1. 1 mark

    uses the steepest section, from 4 to 7 minutes: (3.0 - 1.0) ÷ (7 - 4) / 2.0 km in 3 minutes (1)

    accept 0.67 km per minute for MP1.

  2. 1 mark

    conversion to m and s: 2000 ÷ 180 (1)

    allow MP2 for a correct conversion to m/s of the speed for another moving section (e.g. 2500 ÷ 240 = 10.4 m/s for 8 to 12 minutes).

  3. 1 mark

    11 (m/s) (1)

    accept values that round to 11, e.g. 11.1; An answer of 11 (m/s) with no working scores 3 marks. 10.4 m/s (the section from 8 to 12 minutes) scores MP2 only; 7.6 m/s (the average speed for the whole 12 minutes) scores 0; 0.67 km/min or 40 km/h (correct but not in m/s) scores MP1 only.

Question 4

4 marks

In a cycling road race, one rider has broken away from the main group of riders. On a long, straight, flat road the rider is 450 m ahead of the group.

The rider travels at a constant speed of 12.0 m/s. The group travels at a constant speed of 13.5 m/s.

Calculate the time the group takes to catch up with the rider and the distance the group travels in this time.

Model answer

The group closes the gap by 13.5 - 12.0 = 1.5 m every second.
time to catch up = 450 ÷ 1.5 = 300 s
distance travelled by the group = average speed × time = 13.5 × 300 = 4050 m (4.05 km)
Check: the rider travels 12.0 × 300 = 3600 m, and 3600 + 450 = 4050 m.

Explanation

The group catches up when it has travelled 450 m further than the rider, and it gains 1.5 m every second (the difference in their speeds). Then distance = speed × time gives how far the group travels. Dividing 450 m by one of the speeds instead of the difference in speeds is the commonest error.

Mark scheme
  1. 1 mark

    the group gains 13.5 - 12.0 = 1.5 m every second / 13.5 × t = 450 + 12.0 × t (1)

    MP1 is for a correct method for the catching up: the difference in speeds, or the two distances equated.

  2. 1 mark

    (time =) 450 ÷ 1.5 = 300 (s) (1)

    award MP1 and MP2 for 300 s without working; 450 ÷ 13.5 (= 33 s) or 450 ÷ 12.0 (= 37.5 s) is a wrong method and scores 0 for MP1 and MP2.

  3. 1 mark

    (distance =) 13.5 × 300 (1)

    allow ecf from their time; accept 12.0 × 300 + 450.

  4. 1 mark

    4050 (m) (1)

    accept 4.05 km, 4.1 km or 4100 m; award full marks for correct answers (300 s and 4050 m) without working; 3600 m (12.0 × 300, the distance travelled by the rider who broke away) does not score MP3 or MP4.

Ready to try the rest? Every answer you write is marked against the mark scheme, so you can see exactly where the marks are.

Study Helper Hints first, answers after you try

Stuck on this one? Ask for a hint and I’ll point you in the right direction, without giving the answer away. Once you’ve checked your answer, I’ll show you how the marks are awarded.