
Level:
Correct: 0
Incorrect: 0
Marks: 0/0
Exam Practice
Course:
Topics:
Edexcel GCSE Physics (Paper 1) Smart practice A mixed round aimed at your weak spots
Unit 1
Key concepts of physics
Unit 2
Motion and forces
Unit 3
Conservation of energy
Unit 4
Waves
Unit 5
Light and the electromagnetic spectrum
Unit 6
Radioactivity
Unit 7
Astronomy
Avg
score:
–
Topics
done:
0/40

Acceleration and velocity-time graphs

Practise 18 exam-style questions on Acceleration and velocity-time graphs for Edexcel GCSE Physics (Paper 1). Write your answer as you would in the exam and get it marked in seconds against the mark scheme, point by point, with the Study Helper on hand if you get stuck.

  • 18 questions
  • 1–6 marks each
  • Instant marking
  • No sign-up needed
18 questions, marked as you go

Sample questions with model answers

Here are 4 of the questions in this topic, each with a model answer, an explanation of why it earns the marks and the mark scheme an examiner would use.

Question 1

1 mark

A student draws a velocity-time graph for a journey.

Which feature of the graph gives the distance travelled?

Choose your answer.

  • A the gradient of the line
  • B the highest velocity shown
  • C the area under the line
  • D the length of the line

Model answer

C - the area under the line (between the line and the time axis).

Explanation

On a velocity-time graph, the area between the line and the time axis is velocity × time, which is distance. The gradient is change in velocity ÷ time, which is acceleration. Examiners report that many students mix these up, for example finding an area when an acceleration is asked for.

Mark scheme
  1. 1 mark

    C / the area under the line (1)

    The only correct answer is C: the area between the line and the time axis gives the distance travelled. A is not correct because the gradient of a velocity-time graph gives the acceleration; B is not correct because the highest value on the graph is the maximum velocity, not a distance; D is not correct because the length of the line drawn does not represent any physical quantity. Accept the letter or the option. If more than one option is given, do not award the mark.
Question 2

2 marks

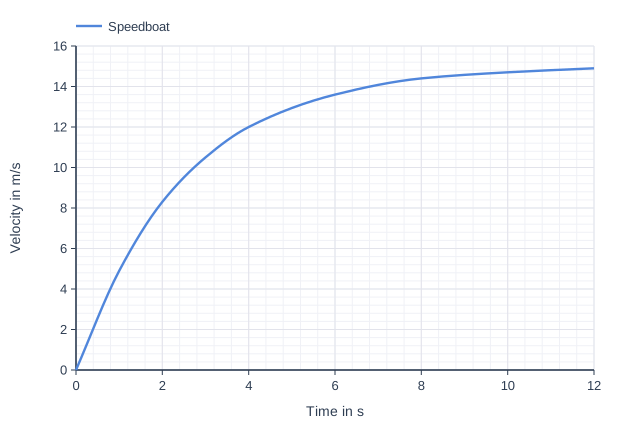
The graph shows how the velocity of a speedboat changes after it starts from rest.

Describe how the acceleration of the speedboat changes during the 12 s, and explain how the graph shows this.

Line graph of velocity in m/s (y-axis, 0 to 16) against time in s (x-axis, 0 to 12). "Speedboat" is a smooth curve through (0, 0), (1, 4.9), (2, 8.3), (3, 10.5), (4, 12), (6, 13.6), (8, 14.4), (10, 14.7), (12, 14.9).

Model answer

The acceleration of the speedboat decreases, until by about 10-12 s it is almost zero and the speedboat moves at a nearly constant velocity of about 15 m/s. The graph shows this because its gradient, which equals the acceleration, decreases - the curve becomes less and less steep until it is almost horizontal.

Explanation

The gradient of a velocity-time graph is the acceleration. Here the curve is steep at the start and flattens out, so the acceleration decreases towards zero while the velocity is still increasing. A common error is to say the speedboat 'slows down' - its velocity never falls; it just increases more and more slowly.

Mark scheme
  1. 1 mark

    the acceleration decreases (until it is (almost) zero) (1)

    Accept 'it accelerates less and less', 'the acceleration gets smaller and the speedboat reaches a (nearly) constant velocity'. Do not accept 'the speedboat slows down' or 'the velocity decreases' (the velocity increases all the time). Do not accept 'the acceleration is constant'.

  2. 1 mark

    the gradient / slope of the line decreases / the line becomes less steep (and is almost horizontal at the end) (1)

    Accept 'the line levels off'. Accept 'the velocity increases by smaller amounts in each second'. Ignore 'the line curves' alone.

Question 3

3 marks

A gannet is a seabird that catches fish by diving into the sea.

A gannet is moving vertically downwards at 6.0 m/s when it folds its wings. It then falls freely through a height of 15 m before it reaches the water. Ignore air resistance.

Calculate the velocity of the gannet when it reaches the water.

Use the equation
v² − u² = 2 × a × x

Model answer

a = g = 10 m/s², u = 6.0 m/s, x = 15 m
v² − u² = 2 × a × x
v² − 6.0² = 2 × 10 × 15
v² = 36 + 300 = 336
v = √336 = 18 m/s (18.3 m/s)

Explanation

A freely falling object accelerates at g = 10 m/s², which must be recalled. Rearranging gives v² = u² + 2ax, so the initial velocity squared (36) is added to 2 × 10 × 15 = 300 before taking the square root. Common errors are leaving out the gannet's starting velocity (giving 17 m/s) and forgetting to take the square root.

Mark scheme
  1. 1 mark

    substitution: v² − 6.0² = 2 × 10 × 15 (1)

    The acceleration is g = 10 m/s² (recalled). Allow use of g = 9.8 or 9.81 m/s² throughout. Award full marks for the correct answer without working. Do not accept a = 6.0 or a = 15.

  2. 1 mark

    rearrangement: v = √(6.0² + 2 × 10 × 15) / v² = 336 (1)

    336 given as the final answer (square root not taken) scores this mark and the first mark only.

  3. 1 mark

    evaluation: 18 (m/s) (1)

    Allow values that round to 18 (m/s), e.g. 18.3 or 18.2 (with g = 9.8). An answer of 17 (m/s) from √(2 × 10 × 15) (the initial velocity left out) is a wrong method and scores 0.

Question 4

4 marks

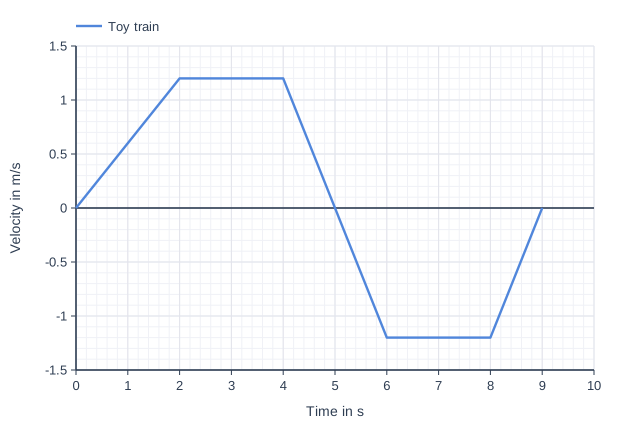
A battery-powered toy train runs forwards along a straight track, then reverses. The graph shows its velocity for 9.0 s. A negative velocity means that the train is moving backwards.

Determine the total distance travelled by the train in the 9.0 s, and how far the train is from its starting point at 9.0 s.

Line graph of velocity in m/s (y-axis, -1.5 to 1.5) against time in s (x-axis, 0 to 10). "Toy train" joins the points (0, 0), (2, 1.2), (4, 1.2), (6, -1.2), (8, -1.2), (9, 0).

Model answer

Distance = area between the line and the time axis. The velocity is zero at 5.0 s.
Forwards (0 to 5.0 s): ½ × 2.0 × 1.2 + 2.0 × 1.2 + ½ × 1.0 × 1.2 = 1.2 + 2.4 + 0.6 = 4.2 m
Backwards (5.0 s to 9.0 s): ½ × 1.0 × 1.2 + 2.0 × 1.2 + ½ × 1.0 × 1.2 = 0.6 + 2.4 + 0.6 = 3.6 m
Total distance travelled = 4.2 + 3.6 = 7.8 m
Distance from the starting point = 4.2 − 3.6 = 0.6 m (in front of where it started)

Explanation

Areas above the time axis are distances moved forwards and areas below are distances moved backwards. The total distance travelled adds them, but the train's final distance from the start is the forward distance minus the backward distance. The key step is seeing that the line crosses the axis at 5.0 s, halfway between 4.0 s and 6.0 s.

Mark scheme
  1. 1 mark

    distance moved forwards (area above the time axis, 0 to 5.0 s) = 1.2 + 2.4 + 0.6 = 4.2 (m) (1)

    The velocity is zero at 5.0 s (the line from 1.2 m/s at 4.0 s to −1.2 m/s at 6.0 s crosses the axis halfway). Accept ½ × (2.0 + 5.0) × 1.2 = 4.2 (m). Answers of 7.8 m (total distance travelled) and 0.6 m (distance from the starting point) with no working score 4 marks.

  2. 1 mark

    distance moved backwards (area below the time axis, 5.0 s to 9.0 s) = 0.6 + 2.4 + 0.6 = 3.6 (m) (1)

    Accept ½ × (2.0 + 4.0) × 1.2 = 3.6 (m). Ignore a negative sign on this area.

  3. 1 mark

    total distance travelled = 4.2 + 3.6 = 7.8 (m) (1)

    Allow ecf from their two areas. Do not accept 0.6 (m) as the total distance (the backward area subtracted).

  4. 1 mark

    distance from the starting point = 4.2 − 3.6 = 0.6 (m) (in front of the start) (1)

    Allow ecf from their two areas. Ignore 'displacement' used or not.

Ready to try the rest? Every answer you write is marked against the mark scheme, so you can see exactly where the marks are.

Study Helper Hints first, answers after you try

Stuck on this one? Ask for a hint and I’ll point you in the right direction, without giving the answer away. Once you’ve checked your answer, I’ll show you how the marks are awarded.