Level:
Correct: 0
Incorrect: 0
Marks: 0/0
Exam Practice
Subject:
Topics:
AQA GCSE Geography (Paper 2) Smart practice A mixed round aimed at your weak spots
Avg
score:
–
Topics
done:
0/23

UK population distribution and a major UK city

Practise 34 exam-style questions on UK population distribution and a major UK city for AQA GCSE Geography (Paper 2). Write your answer as you would in the exam and get it marked in seconds against the mark scheme, point by point, with an AI tutor on hand if you get stuck.

  • 34 questions
  • 1–12 marks each
  • Instant marking
  • No sign-up needed
20 questions, marked as you go

Sample questions with model answers

Here are 4 of the questions in this topic, each with a model answer, an explanation of why it earns the marks and the mark scheme an examiner would use.

Question 1

1 mark

Define the term 'urban greening'.

Model answer

Urban greening is the process of increasing and protecting the amount of green space in a city, such as parks, gardens, street trees and green roofs.

Explanation

Urban greening is about creating and keeping green spaces in built-up areas. A definition needs the idea of the process, not just an example such as 'planting trees'. It is one of the environmental opportunities of urban change named in the specification.

Mark scheme
  1. 1 mark

    Increasing and protecting the amount of green (open) space in a city, e.g. parks, gardens, street trees and green roofs

    accept any clear definition referring to creating or preserving green or open space in urban areas; an example on its own is not enough

Question 2

2 marks

Give two ways in which international migration has changed the cultural character of a UK city you have studied.

Model answer

International migration has led to new places of worship, such as mosques and gurdwaras in Easton in Bristol. It has also brought festivals such as the St Pauls Carnival, which celebrates the city's African-Caribbean culture.

Explanation

Cultural character means the way of life of a city: its food, religion, festivals, languages, music and neighbourhoods. Give two different aspects; naming real places from your case study makes the answer stronger and is good practice for longer questions.

Mark scheme
  1. 1 mark

    New places of worship, e.g. mosques, gurdwaras and temples (e.g. in Easton, Bristol)

    max 2; 1 mark per different way; place-specific examples are not required but should be credited; two examples of the same way (e.g. two restaurants) count once

  2. 1 mark

    Restaurants, food shops and markets selling food from around the world (e.g. Stapleton Road in Bristol, the Curry Mile in Manchester)

  3. 1 mark

    Festivals and carnivals, e.g. St Pauls Carnival in Bristol, Notting Hill Carnival in London

  4. 1 mark

    Many languages spoken / multilingual signs, services and schools

  5. 1 mark

    Neighbourhoods with a distinct cultural identity, e.g. Chinatown in Manchester or London, Brick Lane in London

  6. 1 mark

    Influence on music, art, fashion and sport / a more ethnically diverse, mixed-heritage population

Question 3

4 marks

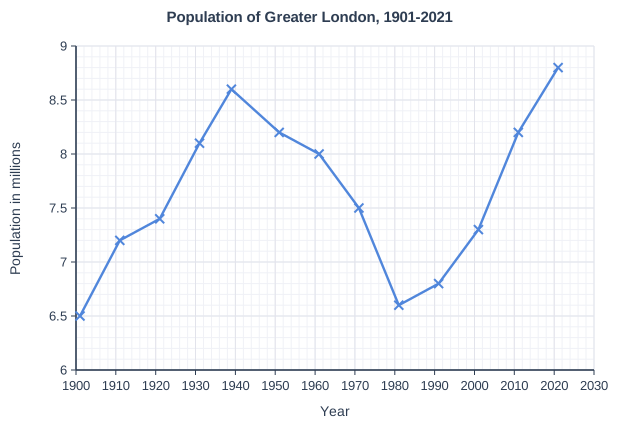
Figure 1 shows the population of Greater London between 1901 and 2021.

Describe the changes in the population of Greater London shown in Figure 1. Use data in your answer.

Population of Greater London, 1901-2021. Line graph of population in millions (y-axis, 6 to 9) against year (x-axis, 1900 to 2030). The line joins the points (1901, 6.5), (1911, 7.2), (1921, 7.4), (1931, 8.1), (1939, 8.6), (1951, 8.2), (1961, 8), (1971, 7.5), (1981, 6.6), (1991, 6.8), (2001, 7.3), (2011, 8.2), (2021, 8.8).

Model answer

London's population grew from about 6.5 million in 1901 to a peak of about 8.6 million in 1939. After this it fell for about 40 years, slowly at first and then more quickly, to a low of about 6.6 million in 1981; the steepest fall was between 1971 and 1981, when it dropped by about 0.9 million. Since 1981 the population has grown again, slowly until 1991 and then rapidly, reaching about 8.8 million in 2021, which is its highest level and above the 1939 peak.

Explanation

Describe the trend in stages (growth, decline, recovery), give the turning points with years and values, and comment on the rate of change. Explanations such as wartime bombing, new towns or international migration are not asked for and earn no marks. Answers without figures from the graph cannot get full marks.

Mark scheme
  1. 1 mark

    The population increased from about 6.5 million in 1901 to a peak of about 8.6 million in 1939

    max 4; 1 mark per valid descriptive point; max 2 if no data are used; accept readings within ±0.1 million; do not credit explanations

  2. 1 mark

    It then decreased for about 40 years to a low of about 6.6 million in 1981

  3. 1 mark

    The fastest decline was between 1971 and 1981 (a fall of about 0.9 million)

  4. 1 mark

    It increased again after 1981, slowly at first (about 6.8 million in 1991) and then rapidly

  5. 1 mark

    The fastest growth was between 2001 and 2011 (from about 7.3 to 8.2 million)

  6. 1 mark

    It reached its highest value of about 8.8 million in 2021, higher than the 1939 peak

  7. 1 mark

    Overall the population increased by about 2.3 million between 1901 and 2021

Question 4

6 marks

Explain how an integrated transport system has created social and economic opportunities in a UK city you have studied.

Model answer

Bristol has been developing an integrated transport system that links buses, trains, park and ride and cycling. A key part is MetroBus, which opened in 2018. Its buses use bus lanes and stretches of guided busway, and tickets are bought before boarding, so journeys are faster and more reliable than ordinary buses. MetroBus routes connect suburbs such as Emersons Green and Hengrove, and the Long Ashton park and ride, with the city centre and Temple Meads station.

This has created social opportunities, because people without cars, such as young people and those on low incomes, can reach jobs, colleges, hospitals and leisure facilities more easily and cheaply. The city's cycle routes, such as the Bristol and Bath Railway Path, give people a cheap and healthy way to travel, and fewer cars improve air quality.

There are also economic opportunities. Park-and-ride sites at Portway, Long Ashton and Brislington take cars off the roads into the centre, reducing congestion, so deliveries and journeys to work are quicker and cheaper for businesses. Temple Meads, with fast trains to London in under two hours, is linked to the city's buses, which has helped attract offices and new companies to the Temple Quarter Enterprise Zone next to the station. Better access also brings more shoppers and visitors into the city centre, supporting jobs in shops, restaurants and attractions.

Explanation

An integrated system links different types of transport, often with shared tickets, so people can change easily between them. The question needs both social opportunities (access to services, health, inclusion) and economic ones (business costs, investment, jobs), explained with real schemes from your case study for Level 3.

Mark scheme
  1. 6 marks

    Levels of response (6 marks).
    Level 3 (5-6 marks): detailed explanation of both social and economic opportunities created by an integrated transport system, with well-developed points; detailed place-specific knowledge of named transport schemes in a UK city.
    Level 2 (3-4 marks): clear explanation with some developed points; may focus mainly on social or on economic opportunities; some place-specific detail.
    Level 1 (1-2 marks): basic explanation with simple statements; generic, not place-specific; may describe transport without explaining opportunities.
    0 marks: nothing worthy of credit.

    Indicative content (not a checklist; credit other valid points): Bristol: MetroBus (opened 2018), a bus rapid transit system using bus lanes and sections of guided busway, linking suburbs such as Cribbs Causeway, Emersons Green and Hengrove and the Long Ashton park and ride to the centre and Temple Meads; tickets bought before boarding speed up journeys; park-and-ride sites (Portway, Long Ashton, Brislington) reduce congestion; Temple Meads station with fast trains to London and the Temple Quarter Enterprise Zone beside it; Bristol Parkway; cycle routes such as the Bristol and Bath Railway Path and Bristol's role as England's first Cycling City (2008); social: easier, cheaper access to jobs, education, hospitals and leisure, especially for people without cars; healthier lifestyles from cycling and walking; cleaner air (Clean Air Zone, 2022); economic: shorter journey times and less congestion reduce costs for businesses; good links attract investment and firms to the city centre and Temple Quarter; more shoppers and visitors reach the centre; construction and transport jobs. London: Oyster card and contactless payment across the Underground, buses, trams and Overground; the Elizabeth line (2022) linking Heathrow, the West End, Canary Wharf and Essex. Manchester: Metrolink trams; credit any appropriate named example.

Ready to try the rest? Every answer you write is marked against the mark scheme, so you can see exactly where the marks are.

AI Tutor Hints first, answers after you try

Hi! Stuck? Ask me for a hint and I’ll help you work it out. Once you’ve checked your answer I can explain exactly where the marks are.