Practise 35 exam-style questions on A city in an LIC or NEE: growth and opportunities for AQA GCSE Geography (Paper 2). Write your answer as you would in the exam and get it marked in seconds against the mark scheme, point by point, with an AI tutor on hand if you get stuck.
35 questions
1–12 marks each
Instant marking
No sign-up needed
20 questions, marked as you go
Sample questions with model answers
Here are 4 of the questions in this topic, each with a model answer, an explanation of why it earns the marks and the mark scheme an examiner would use.
Question 1
1 mark
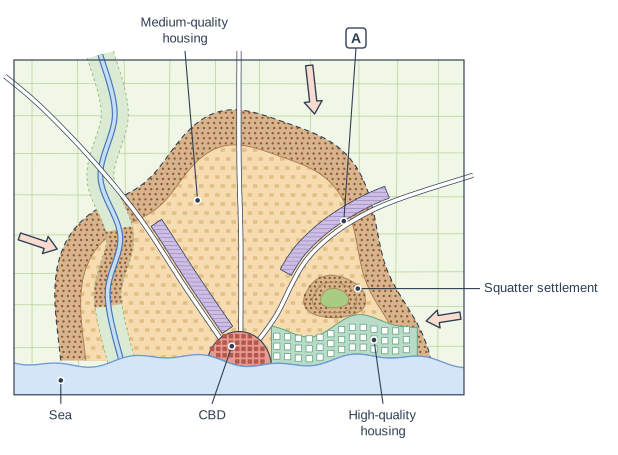
Figure 1 shows a model of land use in a city in an LIC or NEE.
Name the land use labelled A.
Model answer
Industry (an industrial zone of factories).
Explanation
In the model of a city in an LIC or NEE, industry is found in strips along the main roads leading out of the city, where there is good transport access and land is cheaper than in the CBD. These industrial areas provide formal jobs and help to stimulate the city's economic development.
Mark scheme
1 mark
Industry / industrial zone / factories
Accept 'manufacturing'. Do not accept housing, CBD or squatter settlement.
Question 2
2 marks
Give two ways in which the informal economy provides opportunities for migrants in cities in LICs and NEEs.
Model answer
The informal economy gives migrants a way to earn money as soon as they arrive, for example by selling food on the street. It also lets people start their own small businesses without needing qualifications or much money.
Explanation
The informal economy is work that is not officially registered or taxed. Although it has disadvantages (no job security or sick pay), it is a vital economic opportunity for migrants who cannot find formal jobs, as shown by the many small businesses in Dharavi in Mumbai.
Mark scheme
1 mark
Migrants can find work without needing qualifications (e.g. street selling, recycling, shoe shining)
max 2; 1 mark for each valid way.
1 mark
It allows new arrivals to start earning money straight away
1 mark
People can set up their own small businesses cheaply, which can grow (e.g. recycling and pottery businesses in Dharavi, Mumbai)
1 mark
Flexible hours allow people to combine work with family responsibilities
1 mark
Workers gain skills and experience that may help them get formal jobs later
1 mark
It provides cheap goods and services for other low-income residents
Question 3
4 marks
For a city you have studied in an LIC or NEE, explain how urban growth has improved access to education.
Model answer
In Rio de Janeiro, the growth of the city means there are far more schools, colleges and universities than in rural areas of Brazil, so children who move to the city with their families can continue their education beyond primary school. Brazil's Bolsa Família programme pays poor families a monthly grant if their children attend school regularly, which has encouraged children in favelas to stay in education rather than work. New schools have also been built in some favelas as part of upgrading schemes, so children do not have to travel far.
Explanation
Access to education is one of the social opportunities the specification names. Level 2 needs developed explanation (why the change helps people) plus some detail of a real city, such as a named programme or university. A list of 'more schools, more teachers' without development or place detail stays in Level 1.
Mark scheme
4 marks
Levels of response (4 marks). Level 2 (3-4 marks): clear explanation of how urban growth has improved access to education, with linked (developed) points and some accurate place-specific detail about a named city. Level 1 (1-2 marks): basic explanation; simple statements, e.g. 'there are more schools'; generic, with little or no place-specific detail. 0 marks: nothing worthy of credit.
Indicative content (not a checklist; credit other valid points): cities have enough people to support primary and secondary schools, colleges and universities, which are rare in rural areas; more teachers; schools are closer to homes; higher incomes mean families can afford uniforms, books and fees; children are less needed for farm work. Rio de Janeiro: the national Bolsa Familia programme (from 2003) gives cash payments to poor families if their children attend school; new schools and education centres built in favelas as part of upgrading schemes; universities such as the Federal University of Rio de Janeiro; adult literacy and training courses. Lagos: many state primary and secondary schools and universities (e.g. the University of Lagos); the Makoko floating school (2013) was an attempt to bring education to a waterside slum. Mumbai: many schools and colleges; NGOs run schools in Dharavi. Credit any appropriate named example.
Question 4
6 marks
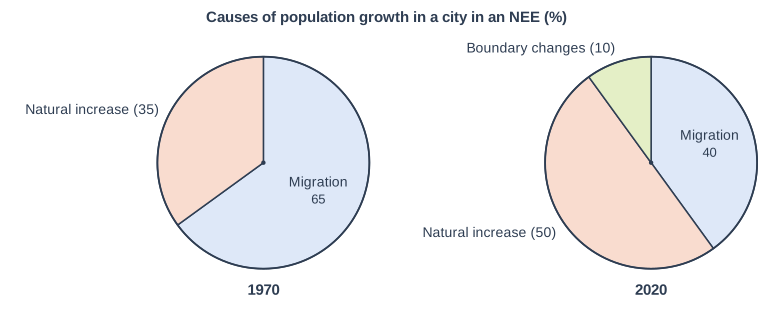
Figure 1 shows the causes of population growth in a city in an NEE in 1970 and 2020. Boundary changes means the city boundary was extended to include nearby settlements.
Using Figure 1 and your own knowledge, explain why natural increase often becomes a more important cause of growth than migration as cities in LICs and NEEs grow.
Model answer
Figure 1 shows that migration caused 65% of the city's growth in 1970 but only 40% in 2020, while natural increase rose from 35% to 50% and became the main cause of growth.
One reason is that most of the migrants who arrived in earlier decades were young adults. Once they settled in the city they had children, so migration in the past leads to high natural increase later. Their children, born in the city, then grow up and have families of their own, creating a large city-born population of young adults. At the same time, healthcare, clean water and vaccinations in the city have reduced the death rate, especially infant mortality, while birth rates have stayed fairly high, so the number of births each year is much greater than the number of deaths.
Migration becomes less important as a country develops. As more of the population lives in cities, there are fewer people left in rural areas to move, and improvements in rural areas, such as new schools, roads and electricity, reduce push factors. Some migrants also move to other growing cities instead. As a result, a city such as Rio de Janeiro, which grew mainly through migration in the 1950s and 1960s, now grows more through natural increase.
Explanation
Level 3 needs evidence from the pie charts and an explanation of both trends: why natural increase grows (young migrants, falling death rates) and why migration becomes relatively less important (smaller rural population, rural development). Simply describing the pie charts stays in Level 1.
Mark scheme
6 marks
Levels of response (6 marks). Level 3 (5-6 marks): detailed, well-developed explanation of why the share of growth from natural increase rises while the share from migration falls; makes effective use of evidence from Figure 1; accurate terminology. Level 2 (3-4 marks): clear explanation with some development; some use of Figure 1; may explain only natural increase or only migration. Level 1 (1-2 marks): basic explanation; simple statements, or description of Figure 1 with little explanation. 0 marks: nothing worthy of credit.
Indicative content (not a checklist; credit other valid points): Figure 1: migration fell from 65% of growth in 1970 to 40% in 2020; natural increase rose from 35% to 50% and became the main cause; boundary changes 10% in 2020. Natural increase rises because earlier migrants were young adults who have children in the city; a large city-born second generation then reaches child-bearing age; better healthcare, clean water and vaccinations lower death rates and infant mortality in the city, while birth rates stay fairly high for a time, so the gap between births and deaths widens; a youthful population means few deaths. Migration becomes relatively less important because the rural population left to migrate gets smaller as the country urbanises; rural development (schools, electricity, roads) reduces push factors; other cities grow and attract migrants; high housing costs and lack of jobs in the city discourage migrants. Later, birth rates also fall (education, contraception), so natural increase may slow too; credit examples such as Rio de Janeiro or Lagos.
Ready to try the rest? Every answer you write is marked against the mark scheme, so you can see exactly where the marks are.
Ctrl + Enter to check
AI TutorHints first, answers after you try
Hi! Stuck? Ask me for a hint and I’ll help you work it out. Once you’ve checked your answer I can explain exactly where the marks are.