Practise 32 exam-style questions on Energy: global supply, demand and insecurity for AQA GCSE Geography (Paper 2). Write your answer as you would in the exam and get it marked in seconds against the mark scheme, point by point, with an AI tutor on hand if you get stuck.
32 questions
1–12 marks each
Instant marking
No sign-up needed
20 questions, marked as you go
Sample questions with model answers
Here are 4 of the questions in this topic, each with a model answer, an explanation of why it earns the marks and the mark scheme an examiner would use.
Question 1
1 mark
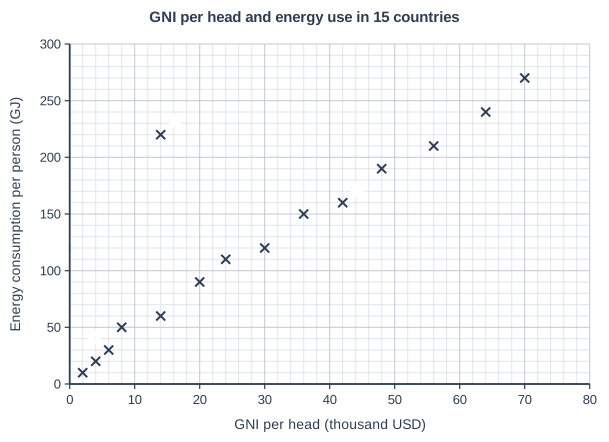
Figure 1 is a scatter graph showing GNI per head and energy consumption per person for 15 countries.
Which one of the labelled points, A, B or C, is an anomaly?
Model answer
A
Explanation
An anomaly is a point that does not fit the general pattern. The other country with a GNI per head of 14 thousand US dollars uses about 60 GJ per person, but point A uses about 220 GJ, far more than the trend suggests. Points B and C lie close to the general upward pattern.
Mark scheme
1 mark
A
accept 'A' or 'point A'; do not accept more than one letter
Question 2
2 marks
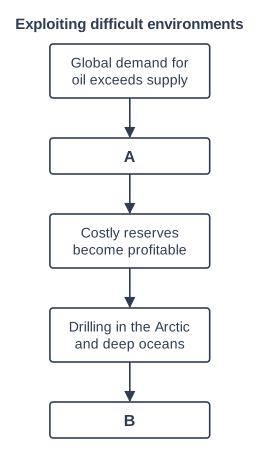
Figure 1 is a flow chart showing how energy insecurity can lead to the exploitation of difficult environments.
Suggest what should go in box A and in box B.
Model answer
A: The price of oil rises. B: There is a greater risk of environmental damage, such as oil spills that harm wildlife in fragile Arctic and ocean ecosystems.
Explanation
When demand exceeds supply, prices rise, so reserves that were too expensive to develop (deep water, the Arctic, oil sands) become profitable. These areas are difficult and environmentally sensitive, so exploiting them brings a higher risk of disasters such as the Deepwater Horizon oil spill in the Gulf of Mexico in 2010.
Mark scheme
1 mark
A: the price of oil rises / oil becomes more expensive
accept energy prices rise; do not accept 'a shortage of oil' alone (already shown in the first box)
1 mark
B: greater risk of environmental damage, e.g. oil spills, damage to fragile ecosystems and wildlife habitats, more greenhouse gas emissions
accept any appropriate cost of exploiting difficult areas, e.g. accidents that kill workers, very high economic costs, harm to indigenous communities
Question 3
4 marks
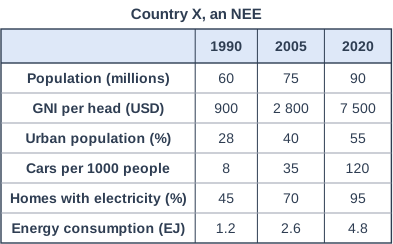
Figure 1 shows changes in Country X, an NEE, between 1990 and 2020.
Using Figure 1, explain why energy consumption in Country X increased.
Model answer
Energy consumption in Country X quadrupled from 1.2 to 4.8 EJ. Part of the reason is population growth: the population rose from 60 to 90 million, so more people needed energy. However, energy use grew much faster than the population, so economic development was more important. GNI per head rose from 900 to 7500 US dollars, so people could afford appliances such as fridges and televisions, and car ownership rose from 8 to 120 per 1000 people, using much more fuel. As the urban population grew from 28% to 55% and homes with electricity rose from 45% to 95%, more people used electricity for lighting and appliances instead of traditional fuels.
Explanation
The question asks you to use the figure, so each reason should be supported by data and linked to energy use. The strongest answers notice that consumption rose four times while population rose only 1.5 times, showing that economic development (rising incomes, cars, electricity access, urbanisation) mattered more than population growth.
Mark scheme
4 marks
Levels of response (4 marks). Level 2 (3-4 marks): clear explanation of why energy consumption increased, linking at least two changes in Figure 1 to greater energy use (e.g. rising incomes → more appliances and cars); makes effective use of data from Figure 1; may recognise that consumption grew faster than population, so development is the main cause. Level 1 (1-2 marks): basic explanation; lists changes in Figure 1 with little or no link to energy use, or explains with no use of the figure. 0 marks: nothing worthy of credit.
Indicative content (not a checklist; credit other valid points): population rose from 60 to 90 million (50%), so more people need energy; GNI per head rose from 900 to 7500 USD, so people can afford appliances (fridges, TVs, air conditioning) and industry grows; economic development means more factories and energy-intensive industry; urban population rose from 28% to 55% - urban lifestyles use more commercial energy (electricity, transport) than rural ones; cars per 1000 people rose from 8 to 120, so much more fuel is used; homes with electricity rose from 45% to 95%, so more households use electricity for lighting and appliances; energy consumption quadrupled while population grew by only half, so consumption per person rose - economic development is a bigger cause than population growth.
Question 4
6 marks
Explain why energy companies are increasingly exploring difficult and environmentally sensitive areas, and the risks this brings.
Model answer
Global demand for energy is rising, but many of the easily reached oil and gas fields are running out; for example, North Sea production has declined since about 2000. To keep supply up and improve energy security, companies are moving into difficult areas such as deep water in the Gulf of Mexico, the Arctic in Alaska and the oil sands of Alberta in Canada. These reserves are expensive to extract, but high energy prices make them profitable, and new technology such as deep-water drilling rigs makes them reachable.
However, these areas are environmentally sensitive, so the risks are high. In 2010 an explosion on the Deepwater Horizon rig in the Gulf of Mexico killed 11 workers and released about 4.9 million barrels of oil, damaging coastal wetlands, wildlife and fishing. In the Arctic, the tundra ecosystem is fragile and recovers very slowly, and oil spills are extremely hard to clean up in icy water. In Alberta, large areas of boreal forest have been cleared for oil sands mining, and toxic tailings ponds threaten rivers and wildlife. Extracting oil from oil sands also produces more greenhouse gases per barrel than conventional oil, adding to climate change.
Explanation
This question has two parts, so a balanced answer explains both the reasons (rising demand, depleted easy reserves, high prices, technology, energy security) and the risks (spills, habitat loss, emissions, danger to workers). Level 3 needs precise, place-specific evidence such as Deepwater Horizon or the Alberta oil sands.
Mark scheme
6 marks
Levels of response (6 marks). Level 3 (5-6 marks): detailed, well-developed explanation of both why difficult and sensitive areas are being explored and the risks this brings; clear links to rising demand and insecure supply; accurate, place-specific examples. Level 2 (3-4 marks): clear explanation with some development; may be unbalanced between reasons and risks; some examples. Level 1 (1-2 marks): basic explanation; simple statements; generic, with little or no reference to real places. 0 marks: nothing worthy of credit.
Indicative content (not a checklist; credit other valid points): reasons - global demand is rising while easily reached conventional reserves are running out (e.g. North Sea output has declined since about 2000); high energy prices make expensive reserves profitable; new technology (deep-water rigs, fracking, oil sands extraction) makes them accessible; governments want greater energy security and less reliance on imports; examples - deep water in the Gulf of Mexico and off Brazil; the Arctic (Prudhoe Bay, Alaska; debate over drilling in the Arctic National Wildlife Refuge); the Alberta oil sands in Canada. Risks - oil spills: the Deepwater Horizon explosion in the Gulf of Mexico in 2010 killed 11 workers and released about 4.9 million barrels of oil, harming wildlife and fishing; the Exxon Valdez spill in Alaska in 1989; Arctic tundra is fragile and recovers very slowly, and spills are hard to clean up in ice; permafrost damage; in Alberta large areas of boreal forest are cleared and toxic tailings ponds threaten water and wildlife; harm to indigenous peoples' ways of life; very high costs and dangerous working conditions; extracting oil sands releases more greenhouse gases per barrel than conventional oil.
Ready to try the rest? Every answer you write is marked against the mark scheme, so you can see exactly where the marks are.
Ctrl + Enter to check
AI TutorHints first, answers after you try
Hi! Stuck? Ask me for a hint and I’ll help you work it out. Once you’ve checked your answer I can explain exactly where the marks are.