Level:
Correct: 0
Incorrect: 0
Marks: 0/0
Exam Practice
Subject:
Topics:
AQA GCSE Geography (Paper 2) Smart practice A mixed round aimed at your weak spots
Avg
score:
–
Topics
done:
0/23

Food: global supply, demand and insecurity

Practise 32 exam-style questions on Food: global supply, demand and insecurity for AQA GCSE Geography (Paper 2). Write your answer as you would in the exam and get it marked in seconds against the mark scheme, point by point, with an AI tutor on hand if you get stuck.

  • 32 questions
  • 1–12 marks each
  • Instant marking
  • No sign-up needed
20 questions, marked as you go

Sample questions with model answers

Here are 4 of the questions in this topic, each with a model answer, an explanation of why it earns the marks and the mark scheme an examiner would use.

Question 1

1 mark

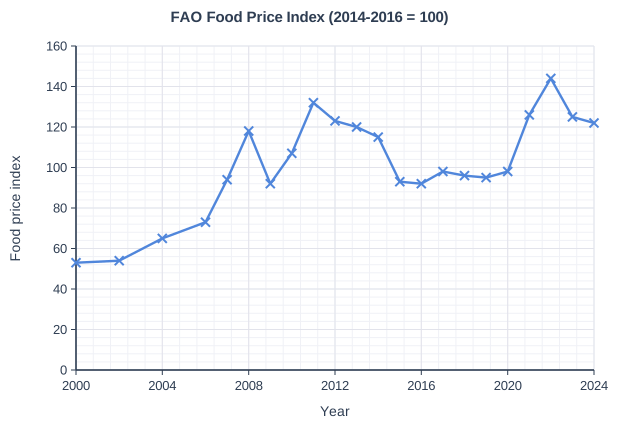
Figure 1 shows the FAO Food Price Index, which measures changes in world food prices, between 2000 and 2024.

Using Figure 1, state the year in which the Food Price Index was highest.

FAO Food Price Index (2014-2016 = 100). Line graph of food price index (y-axis, 0 to 160) against year (x-axis, 2000 to 2024). The line joins the points (2000, 53), (2002, 54), (2004, 65), (2006, 73), (2007, 94), (2008, 118), (2009, 92), (2010, 107), (2011, 132), (2012, 123), (2013, 120), (2014, 115), (2015, 93), (2016, 92), (2017, 98), (2018, 96), (2019, 95), (2020, 98), (2021, 126), (2022, 144), (2023, 125), (2024, 122).

Model answer

2022

Explanation

The highest point on the graph is in 2022, when the index reached about 144, higher than the earlier peaks in 2008 (about 118) and 2011 (about 132). Check every peak rather than picking the first one you see.

Mark scheme
  1. 1 mark

    2022

    Do not accept 2011 (the second highest peak).

Question 2

2 marks

A family in a low-income country spends 60% of its income on food. Food prices then rise by 50%, but the family's income stays the same.

Calculate the percentage of its income the family would now need to spend to buy the same amount of food.

Model answer

50% of 60 = 30
60 + 30 = 90%
The family would need to spend 90% of its income to buy the same food.

Explanation

A 50% price rise means the food now costs one and a half times as much, so 60% becomes 90%, leaving only 10% for everything else. This is why rising food prices push poor families into hunger, while a household in a high-income country such as the UK, spending only around 10% of its income on food, is far less affected.

Mark scheme
  1. 1 mark

    Working: 60 × 1.5 / 60 + (50% of 60 = 30)

  2. 1 mark

    90%

    Do not accept 110% (adding 50 to 60). Correct answer with no working scores full marks.

Question 3

4 marks

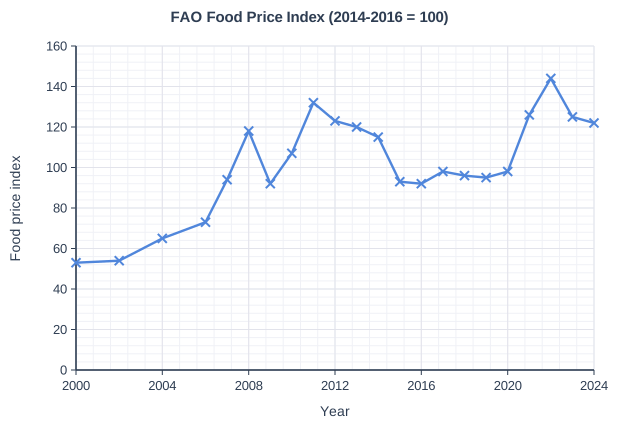
Figure 1 shows the FAO Food Price Index, which measures changes in world food prices, between 2000 and 2024.

Using Figure 1 and your own knowledge, suggest reasons for the sharp rises in world food prices in 2007-2008 and in 2021-2022.

FAO Food Price Index (2014-2016 = 100). Line graph of food price index (y-axis, 0 to 160) against year (x-axis, 2000 to 2024). The line joins the points (2000, 53), (2002, 54), (2004, 65), (2006, 73), (2007, 94), (2008, 118), (2009, 92), (2010, 107), (2011, 132), (2012, 123), (2013, 120), (2014, 115), (2015, 93), (2016, 92), (2017, 98), (2018, 96), (2019, 95), (2020, 98), (2021, 126), (2022, 144), (2023, 125), (2024, 122).

Model answer

Figure 1 shows that the index rose from about 73 in 2006 to 118 in 2008, and from about 98 in 2020 to 144 in 2022, the highest level on the graph.

In 2007-2008 high oil prices made fertiliser, fuel for machinery and transport more expensive, raising the cost of producing food. At the same time, more maize was being used to make biofuels, droughts reduced harvests in major exporters such as Australia, and demand was rising in growing economies such as China. Some countries banned exports of rice to protect their own people, which pushed world prices even higher.

In 2021-2022 supply chains were still disrupted after the Covid-19 pandemic. Then, in 2022, Russia invaded Ukraine; both countries are major exporters of wheat and sunflower oil, so exports through the Black Sea were disrupted. Energy and fertiliser prices also soared, because Russia is a major supplier of both, increasing farming costs around the world.

Explanation

Use the graph to show when and how sharply prices rose, then suggest causes for each period. Strong answers link causes to supply or cost (oil, fertiliser, biofuels, drought, war) rather than just saying 'there was a shortage'.

Mark scheme
  1. 4 marks

    Levels of response (4 marks).
    Level 2 (3-4 marks): clear suggestions of reasons for BOTH price rises, with developed points; uses evidence from Figure 1 (e.g. the size or timing of the rises).
    Level 1 (1-2 marks): basic suggestions with simple, unlinked points; may cover only one period; little use of Figure 1.
    0 marks: nothing worthy of credit.

    Indicative content (not a checklist; credit other valid points): Figure 1 - the index rose from about 73 in 2006 to 118 in 2008, and from about 98 in 2020 to 144 in 2022, the highest on the graph. 2007-2008 - high oil prices raised the cost of fertiliser, machinery fuel and transport; growing use of crops such as maize for biofuels reduced the grain available for food; droughts in major exporters (e.g. Australia) cut harvests; rising demand from growing economies such as China and India; some countries banned exports (e.g. of rice) to protect their own supplies; speculation by traders. 2021-2022 - recovery from the Covid-19 pandemic disrupted supply chains and shipping; Russia's invasion of Ukraine in 2022 disrupted grain and sunflower oil exports from two of the world's largest wheat exporters; energy and fertiliser prices soared (Russia is a major fertiliser exporter); droughts and heatwaves in some producing regions; export restrictions.

Question 4

6 marks

Explain how food insecurity can lead to conflict and social unrest.

Model answer

Food insecurity can lead to social unrest when food prices rise quickly. Poor families in LICs spend a large share of their income on food, so a sudden price rise means they cannot afford to eat. During the 2007-2008 food price crisis there were food riots in many countries, including Haiti, Egypt and Bangladesh; in Haiti the protests led to the prime minister being removed. In 2011, high bread prices were one of the grievances that fuelled the protests of the Arab Spring in North Africa and the Middle East.

Food insecurity can also cause violent conflict when groups compete for scarce resources needed to produce food. In the Sahel and in Nigeria's Middle Belt, droughts and desertification have pushed herders to move their cattle onto farmland, leading to deadly clashes with farmers. Competition for land and water was also one of the factors behind the conflict in Darfur in Sudan.

In addition, food shortages force people to migrate in search of food, which can create tension with the communities they move into. Armed groups may also seize food supplies or control aid to gain power over people. Once conflict starts it disrupts farming and blocks aid, making food insecurity even worse, so the two problems reinforce each other in a cycle.

Explanation

Explain the mechanisms: price rises lead to protests, competition for land and water leads to violent conflict, and migration and the control of food lead to tension. Real examples (Haiti 2008, the Arab Spring, farmer-herder clashes in Nigeria) and the idea of a cycle help reach Level 3.

Mark scheme
  1. 6 marks

    Levels of response (6 marks).
    Level 3 (5-6 marks): detailed, well-developed explanation of a range of ways food insecurity can lead to unrest and conflict (e.g. price rises and protests, competition for land and water, migration), with clear causal links; supported by accurate examples.
    Level 2 (3-4 marks): clear explanation with some development; examples may be general.
    Level 1 (1-2 marks): basic statements (e.g. 'hungry people get angry'); little explanation.
    0 marks: nothing worthy of credit.

    Indicative content (not a checklist; credit other valid points): when food prices rise sharply, poor people who spend most of their income on food cannot afford to eat, leading to protests and riots, e.g. food riots in Haiti, Egypt and Bangladesh during the 2007-2008 price crisis (in Haiti the prime minister was removed); high bread prices were one of the grievances behind the protests of the Arab Spring in 2011; anger at governments seen as failing to provide food can lead to political instability; competition for scarce farmland, pasture and water between groups, e.g. between farmers and herders in Nigeria's Middle Belt and the Sahel, or in Darfur (Sudan), can turn violent, especially in droughts; food shortages force people to migrate, causing tension with host communities; armed groups may use control of food supplies or aid to gain power; countries may compete over shared rivers used for irrigation; conflict then worsens food insecurity, creating a cycle.

Ready to try the rest? Every answer you write is marked against the mark scheme, so you can see exactly where the marks are.

AI Tutor Hints first, answers after you try

Hi! Stuck? Ask me for a hint and I’ll help you work it out. Once you’ve checked your answer I can explain exactly where the marks are.