Practise 30 exam-style questions on Resources in the UK: water for AQA GCSE Geography (Paper 2). Write your answer as you would in the exam and get it marked in seconds against the mark scheme, point by point, with an AI tutor on hand if you get stuck.
30 questions
1–12 marks each
Instant marking
No sign-up needed
20 questions, marked as you go
Sample questions with model answers
Here are 4 of the questions in this topic, each with a model answer, an explanation of why it earns the marks and the mark scheme an examiner would use.
Question 1
1 mark
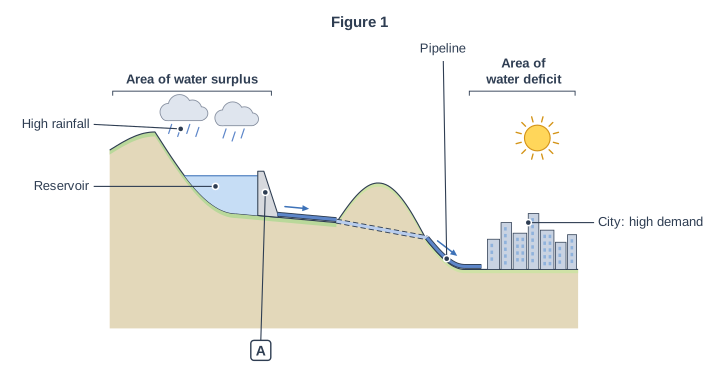
Figure 1 shows a model of a water transfer scheme.
Name the feature labelled A.
Model answer
A dam.
Explanation
The dam is the wall built across a valley to hold back water, creating a reservoir behind it. In a transfer scheme the dam lets water be stored in the wet uplands and released at a controlled rate into a pipeline or river to supply a distant city.
Mark scheme
1 mark
Dam
Accept dam wall / concrete dam / barrage. Do not accept reservoir (that is the water held behind it) or pipeline.
Question 2
2 marks
Outline one way in which water pollution is managed in the UK.
Model answer
Some farmland is in Nitrate Vulnerable Zones, where farmers must limit how much fertiliser and manure they spread and when. This means fewer nitrates are washed off the fields into rivers, so there is less eutrophication.
Explanation
An 'outline' question wants one method plus a short explanation of how it works. Naming the method gets one mark; saying how it improves water quality gets the second.
Mark scheme
1 mark
A valid way of managing water pollution, e.g. Nitrate Vulnerable Zones limit fertiliser use / sewage treatment works clean waste water / the Thames Tideway Tunnel (super sewer) stores storm sewage / the Environment Agency monitors rivers and fines polluters / buffer strips of vegetation beside rivers / water treatment (filtering and chlorination) before supply
1 mark for the method
1 mark
Development explaining how it reduces pollution, e.g. so fewer nitrates are washed into rivers, reducing eutrophication / harmful bacteria and solids are removed before water returns to rivers / sewage no longer overflows into the river in heavy rain / fines deter companies from polluting / vegetation traps soil and fertiliser in run-off / drinking water is made safe
Development of the previous point
Question 3
4 marks
Explain why south-east England is an area of water deficit.
Model answer
South-east England has a water deficit because demand is much higher than the local supply. Supply is limited because the region receives little rain - London gets only about 600 mm a year. The prevailing south-westerly winds drop most of their rain on the uplands of the west and north before they reach the south-east, and warm summers increase evaporation. At the same time, demand is very high because London and the South East have the highest population density in the UK, and the population is growing as people move there for jobs, so many new homes are being built. As a result, demand is greater than the water available and the area is seriously water stressed.
Explanation
Top answers explain both sides of the balance: why supply is low (rainfall, rain shadow, evaporation, reliance on groundwater) and why demand is high (dense, growing population, lifestyles). Simply listing 'little rain' and 'lots of people' without linking them to supply and demand stays in Level 1.
Mark scheme
4 marks
Levels of response (4 marks). Level 2 (3-4 marks): clear explanation that links low water supply AND high demand to the deficit, with developed points (e.g. low rainfall because the region is in the rain shadow of the western uplands; a dense, growing population increases demand); accurate use of terminology. Level 1 (1-2 marks): basic explanation with simple, unlinked points (e.g. 'it does not rain much', 'lots of people live there'); may cover only supply or only demand. 0 marks: nothing worthy of credit.
Indicative content (not a checklist; credit other valid points): a deficit is when demand is greater than supply; the south-east receives low rainfall (often under 700 mm a year; London about 600 mm) compared with over 2000 mm in parts of the western uplands; prevailing south-westerly winds drop most of their rain over the west and north-west uplands first, so the south-east is in a rain shadow; higher summer temperatures increase evaporation; much of the region's water comes from chalk aquifers, which need winter rain to recharge and run low in dry years; the region is lowland, with few deep upland valleys suitable for large reservoirs; it has the highest population density in the UK (London and the South East together have a large share of the UK population); the population is growing because of migration and new housing; wealthier lifestyles with gardens and appliances raise demand per person; so demand outstrips the local supply and the area is classed as seriously water stressed.
Question 4
6 marks
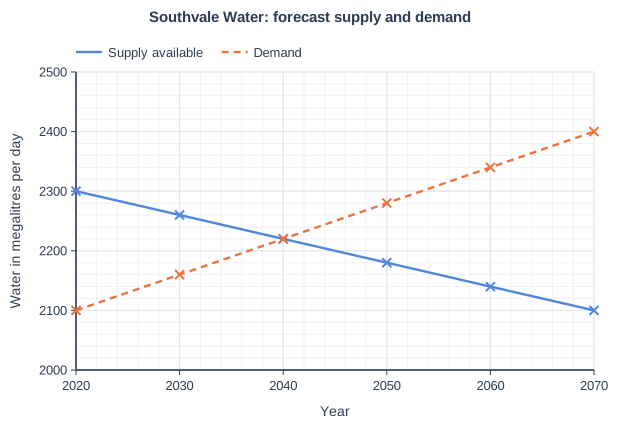
Figure 1 shows the forecast water supply and demand for the area served by Southvale Water, a water company in south-east England.
Using Figure 1 and your own knowledge, suggest how the water company could prevent the deficit shown.
Model answer
Figure 1 shows that supply is forecast to fall from 2300 to 2100 megalitres per day between 2020 and 2070, while demand rises from 2100 to 2400. The two are equal in 2040, and after that a deficit opens up, reaching 300 megalitres per day by 2070. The company could tackle this by reducing demand and by increasing supply.
To reduce demand, the company should first fix leaking pipes, because a lot of treated water is lost before it reaches customers. It could fit water meters to every home, as people who pay for what they use tend to use less, and work with builders to put water-efficient toilets and showers in new homes. Education campaigns and hosepipe bans in droughts would also cut demand at peak times.
To increase supply, the company could build a new reservoir to store winter rainfall, build a desalination plant like the one at Beckton on the Thames estuary, or buy water transferred from areas of surplus in the north and west. These schemes are expensive and take many years to build, so they would need to be planned now to be ready before 2040. Because the gap becomes so large, a combination of cutting demand and adding supply is the most realistic way to prevent the deficit.
Explanation
Start by using the graph: when the deficit begins and how big it becomes, since this shows the scale of action needed. Then suggest strategies on both sides (reducing demand, increasing supply) and explain how each helps. Level 3 answers often add a judgement, such as which methods are quickest or cheapest.
Mark scheme
6 marks
Levels of response (6 marks). Level 3 (5-6 marks): detailed, well-developed suggestions of a range of strategies to reduce demand and/or increase supply, clearly explaining how each would help close the gap; makes effective use of Figure 1 (e.g. when the deficit begins and how large it becomes); may comment on which strategies would work best or soonest. Level 2 (3-4 marks): clear suggestions with some development; some use of Figure 1. Level 1 (1-2 marks): basic suggestions with simple statements; little or no use of Figure 1. 0 marks: nothing worthy of credit.
Indicative content (not a checklist; credit other valid points): Figure 1 - supply falls from 2300 to 2100 megalitres per day while demand rises from 2100 to 2400; they are equal in 2040; after that a deficit grows to 200 megalitres per day in 2060 and 300 in 2070 (demand would need to fall by about 12.5% in 2070 to match supply). Reducing demand - fix leaks (a large share of water put into supply is lost); fit water meters to all homes so people pay for what they use; promote or require water-efficient appliances, dual-flush toilets and showerheads, especially in new homes; education campaigns; hosepipe bans during droughts. Increasing supply - build a new reservoir to store winter rainfall; desalination plant on the coast or estuary (e.g. Beckton on the Thames); recycle treated waste water; take more groundwater if aquifers allow; transfer water from areas of surplus (e.g. proposed transfers from the River Severn to the Thames, or a national water grid). Judgement - reducing demand is cheaper and quicker; large supply schemes take many years, so they must be planned well before 2040; a combination is most likely to close a 300 megalitre per day gap.
Ready to try the rest? Every answer you write is marked against the mark scheme, so you can see exactly where the marks are.
Ctrl + Enter to check
AI TutorHints first, answers after you try
Hi! Stuck? Ask me for a hint and I’ll help you work it out. Once you’ve checked your answer I can explain exactly where the marks are.