Level:
Correct: 0
Incorrect: 0
Marks: 0/0
Exam Practice
Course:
Topics:
AQA A-Level Biology (Paper 3) Smart practice A mixed round aimed at your weak spots
Unit 1
Required practical activities
Unit 2
Practical and mathematical skills
Unit 3
Critical analysis of experimental data
Unit 4
The essay
Avg
score:
–
Topics
done:
0/26

Required practical 3: water potential of plant tissue

Practise 15 exam-style questions on Required practical 3: water potential of plant tissue for AQA A-Level Biology (Paper 3). Write your answer as you would in the exam and get it marked in seconds against the mark scheme, point by point, with the Study Helper on hand if you get stuck.

  • 15 questions
  • 1–8 marks each
  • Instant marking
  • No sign-up needed
15 questions, marked as you go

Sample questions with model answers

Here are 4 of the questions in this topic, each with a model answer, an explanation of why it earns the marks and the mark scheme an examiner would use.

Question 1

2 marks

A student suggested using sodium chloride solutions instead of sucrose solutions to find the water potential of radish tissue. Her teacher suggested using mannitol, a solute that does not cross plant cell membranes.

Explain why a solute that does not cross cell membranes should be used in this investigation.

Model answer

If the solute could cross the membranes, it would enter the cells during the investigation. This would lower the water potential of the cells and raise the water potential of the solution, so the change in mass would not be caused only by water moving by osmosis, and the intercept would not give the water potential of the original tissue.

Explanation

The method assumes that only water crosses the membranes, so that the water potentials of the solutions stay as labelled and the change in mass shows the net movement of water by osmosis. Ions such as Na⁺ and Cl⁻ can enter cells through channel and carrier proteins, and may harm them; sucrose and mannitol cross membranes very slowly, so they are suitable.

Mark scheme
  1. 1 mark

    If the solute enters the cells, it lowers the water potential of the cells (and raises the water potential of the solution) during the investigation

    Max 2. Accept "the concentrations / water potentials inside and outside would change as the solute moves".

  2. 1 mark

    So the change in mass would not be caused only by the movement of water (by osmosis) / the intercept would not give the original water potential of the tissue

  3. 1 mark

    Ions such as sodium and chloride may be taken up (e.g. by active transport or channel proteins) or may damage the cells (toxic)

    Accept "sodium chloride could affect the membranes or metabolism of the cells".
Question 2

3 marks

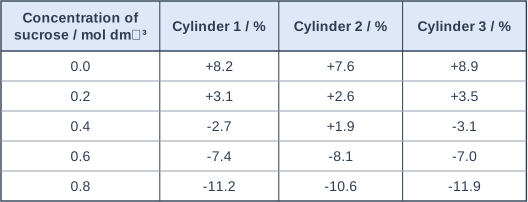
A student placed three cylinders of pear tissue in each of five sucrose solutions. After 3 hours she calculated the percentage change in mass of each cylinder.

The table shows her results.

Identify the anomalous result.

Suggest two possible causes of this anomalous result.

Table with columns "Concentration of sucrose / mol dm⁻³", "Cylinder 1 / %", "Cylinder 2 / %", "Cylinder 3 / %". Concentration of sucrose / mol dm⁻³: 0.0; Cylinder 1 / %: +8.2; Cylinder 2 / %: +7.6; Cylinder 3 / %: +8.9 | Concentration of sucrose / mol dm⁻³: 0.2; Cylinder 1 / %: +3.1; Cylinder 2 / %: +2.6; Cylinder 3 / %: +3.5 | Concentration of sucrose / mol dm⁻³: 0.4; Cylinder 1 / %: -2.7; Cylinder 2 / %: +1.9; Cylinder 3 / %: -3.1 | Concentration of sucrose / mol dm⁻³: 0.6; Cylinder 1 / %: -7.4; Cylinder 2 / %: -8.1; Cylinder 3 / %: -7.0 | Concentration of sucrose / mol dm⁻³: 0.8; Cylinder 1 / %: -11.2; Cylinder 2 / %: -10.6; Cylinder 3 / %: -11.9.

Model answer

The anomalous result is +1.9% (cylinder 2 in 0.4 mol dm⁻³ sucrose); the other two cylinders in this solution lost mass.

1. The cylinder was not blotted dry before the final weighing, so solution on its surface increased its final mass.
2. The cylinder was put into the wrong tube, containing a more dilute solution.

Explanation

An anomaly is a result that does not fit the pattern of its repeats or of the other results. Here one cylinder gained mass in a solution where its repeats lost about 3%, so any suggested cause must make the result too high: surface liquid not blotted off, the wrong (more dilute) solution, or a recording error. Causes that would make the result lower, such as not blotting before the first weighing, do not explain it.

Mark scheme
  1. 1 mark

    +1.9 (%) (cylinder 2 in 0.4 mol dm⁻³)

    Max 3. Accept "the result for cylinder 2 at 0.4 mol dm⁻³".

  2. 1 mark

    The cylinder was not blotted (or not blotted enough) before the final weighing, so surface solution added to its final mass

    Points 2 to 5: 1 mark each, max 2. Each cause must make the result too high (more positive). List rule: if more than two causes are given, each wrong extra answer cancels one correct answer. Do not credit "not blotted before the first weighing" (this would make the result too low) or "evaporation".

  3. 1 mark

    The cylinder was put in the wrong (more dilute) solution, e.g. 0.2 mol dm⁻³ or distilled water

  4. 1 mark

    A mass was misread or recorded wrongly (final mass too high or initial mass too low) / the percentage was miscalculated

  5. 1 mark

    The cylinder was cut from a part of the pear whose cells have a lower water potential (e.g. near the core or skin), or was damaged

    Accept "the cylinder came from a different pear".

Question 3

4 marks

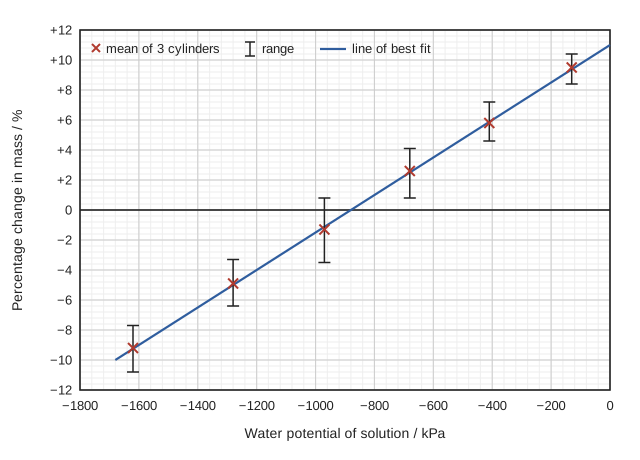
A student cut cylinders from a butternut squash and placed three cylinders in each of six solutions of known water potential. After 3 hours she calculated the percentage change in mass of each cylinder.

The graph shows the mean for each solution, the range of the three results and her line of best fit.

Use the line of best fit to find the water potential of the squash tissue.

The range bar at -970 kPa crosses 0%. Explain what this shows.

Suggest one reason why the three cylinders in the same solution gave different results, and how the student could reduce this variation.

Graph of percentage change in mass (y-axis, -12 to +12%) against water potential of solution (x-axis, -1800 to 0 kPa). Crosses show the mean of 3 cylinders at -130, -410, -680, -970, -1280 and -1620 kPa, each with a vertical range bar. Means: +9.5, +5.8, +2.6, -1.3, -4.9 and -9.2%. Ranges: +8.4 to +10.4, +4.6 to +7.2, +0.8 to +4.1, -3.5 to +0.8, -6.4 to -3.3 and -10.8 to -7.7%. A straight line of best fit rises from -10.0% at -1680 kPa to +11.0% at 0 kPa.

Model answer

The line of best fit crosses 0% at -880 kPa, so the water potential of the squash tissue is -880 kPa.

At -970 kPa one cylinder gained mass while the other two lost mass. This shows that the cylinders had different water potentials, some higher and some lower than -970 kPa, so the tissue water potential varies and the value of -880 kPa is not exact.

The cylinders were probably cut from different parts of the squash, where the cells have different water potentials. The student should cut all the cylinders from the same region of the squash, all the same size using a cork borer.

Explanation

The water potential of the tissue is read where the line of best fit crosses 0% change in mass, because there is no net movement of water by osmosis there. Range bars show the spread of the repeats: when a bar crosses zero, some cylinders gained and some lost mass in the same solution, showing biological variation between cylinders. Cutting cylinders of the same size from one region and treating them identically reduces this variation.

Mark scheme
  1. 1 mark

    -880 kPa (accept -860 to -900)

    Accept the answer without a minus sign only if the answer says the water potential is "minus" or "negative". Do not accept a positive value.

  2. 1 mark

    At -970 kPa some cylinders gained mass and others lost mass, so the cylinders/cells had different water potentials (some above and some below -970 kPa) / the tissue water potential varies, so the estimate is uncertain

    Accept "the water potential of some cylinders was lower than -970 kPa and of others higher". Insufficient: "the results are not reliable" alone.

  3. 1 mark

    Reason: cylinders were cut from different parts of the squash (cells in different regions have different water potentials) / cylinders had different dimensions or surface areas / cylinders were blotted differently

    Points 3 and 4 are a pair: point 4 can score only if it matches the reason given in point 3.

  4. 1 mark

    Matching way to reduce it: cut all cylinders from the same region of the squash / use a cork borer and cut every cylinder to the same length / blot every cylinder in the same standard way (e.g. roll once on paper towel)

Question 4

6 marks

Kohlrabi is a vegetable with a swollen stem made of storage tissue.

Describe how you would find the water potential of kohlrabi stem tissue.

You are given:
- a kohlrabi stem
- 1.0 mol dm⁻³ sucrose solution, distilled water and a table of the water potentials of sucrose solutions
- a cork borer, a scalpel, a white tile and a ruler
- a balance reading to 0.01 g, paper towels, boiling tubes, graduated pipettes and a water bath.

Model answer

Use the 1.0 mol dm⁻³ sucrose solution and distilled water to make 10 cm³ each of 0, 0.2, 0.4, 0.6, 0.8 and 1.0 mol dm⁻³ sucrose (for example 4 cm³ of sucrose solution and 6 cm³ of water for 0.4 mol dm⁻³), in labelled boiling tubes in a water bath at 25 °C.
Use the cork borer, pressing down onto the tile, to cut cylinders from the same part of the stem, and cut each to 3 cm with the scalpel and ruler.
Blot each cylinder dry in the same way, weigh it and put three cylinders in each tube so they are fully covered. Cover the tubes.
After 3 hours, remove each cylinder, blot it in the same way and reweigh it. Calculate the percentage change in mass for each and the mean for each concentration.
Plot mean percentage change in mass against sucrose concentration, draw a line of best fit and find the concentration where it crosses 0%. Use the table to convert this concentration into a water potential: this is the water potential of the kohlrabi cells.

Explanation

The method needs a dilution series either side of the expected value, cylinders of the same size from the same tissue, consistent blotting, enough time at a constant temperature for the tissue to reach equilibrium, percentage change in mass (because initial masses differ), repeats and a graph whose intercept at 0% gives the solution with the same water potential as the tissue. A common omission is the final step of converting the intercept concentration into a water potential.

Mark scheme
  1. 1 mark

    Dilute the 1.0 mol dm⁻³ sucrose solution with distilled water to make a range of (at least five) concentrations, e.g. 0, 0.2, 0.4, 0.6, 0.8 and 1.0 mol dm⁻³ (with stated volumes, e.g. 4 cm³ sucrose + 6 cm³ water for 0.4)

    Max 4 if the answer does not describe finding the concentration or water potential at which there is no change in mass. Max 6.

  2. 1 mark

    Use the cork borer (on a tile) and cut the cylinders to the same length with a scalpel and ruler (so they have the same surface area/size)

    Accept "remove the skin/outer layer".

  3. 1 mark

    Blot the cylinders dry (in the same way) and weigh each one (record the initial mass)

  4. 1 mark

    Put one or more cylinders in the same volume of each solution, fully covered, for the same length of time (e.g. 30 minutes at 30 °C, or several hours at room temperature)

    The mark is for the same volume and the same time, with the cylinders covered by the solution. Accept any stated time of 20 minutes or more. Accept "cover the tubes (to prevent evaporation)" as an addition.

  5. 1 mark

    Keep the temperature constant, e.g. tubes in a water bath at 25 °C

  6. 1 mark

    Remove, blot dry in the same way and reweigh; calculate the percentage change in mass

    Accept "change in mass ÷ initial mass × 100".

  7. 1 mark

    Repeat (with at least three cylinders per concentration) and calculate a mean percentage change

  8. 1 mark

    Plot percentage change in mass against concentration (or water potential) of the solution and find where the line of best fit crosses 0% change

  9. 1 mark

    Use the table to convert the concentration at the intercept into a water potential (this is the water potential of the tissue)

    Accept reading the water potential directly if the graph was plotted against water potential.

  10. 1 mark

    Safety: cut with the cork borer and scalpel pressing down onto the tile and away from the fingers

    Credit only if linked to the borer or scalpel.

Ready to try the rest? Every answer you write is marked against the mark scheme, so you can see exactly where the marks are.

Study Helper Hints first, answers after you try

Stuck on this one? Ask for a hint and I’ll point you in the right direction, without giving the answer away. Once you’ve checked your answer, I’ll show you how the marks are awarded.