Level:
Correct: 0
Incorrect: 0
Marks: 0/0
Exam Practice
Course:
Topics:
AQA A-Level Biology (Paper 3) Smart practice A mixed round aimed at your weak spots
Unit 1
Required practical activities
Unit 2
Practical and mathematical skills
Unit 3
Critical analysis of experimental data
Unit 4
The essay
Avg
score:
–
Topics
done:
0/26

Data analysis: exchange and transport

Practise 14 exam-style questions on Data analysis: exchange and transport for AQA A-Level Biology (Paper 3). Write your answer as you would in the exam and get it marked in seconds against the mark scheme, point by point, with the Study Helper on hand if you get stuck.

  • 14 questions
  • 5–9 marks each
  • Instant marking
  • No sign-up needed
14 questions, marked as you go

Sample questions with model answers

Here are 4 of the questions in this topic, each with a model answer, an explanation of why it earns the marks and the mark scheme an examiner would use.

Question 1

6 marks

The alveoli are lined with a thin film of water. Surface tension where this water meets the air tends to make the alveoli collapse. Cells in the alveolar walls secrete surfactant, a mixture that consists mainly of phospholipids. Surfactant forms a layer at the surface between the air and the water and reduces surface tension. Babies born very early often produce too little surfactant.

Doctors randomly allocated 260 babies born very early to two groups. Within an hour of birth, babies in one group were given surfactant through a tube into the trachea; babies in the other group were given a small volume of air in the same way. The table shows the results.

Calculate the percentage reduction in the death rate (deaths per baby) in the surfactant group compared with the control group. Give your answer to 2 significant figures.

Use your knowledge of the structure of phospholipids to explain how they form a layer at the surface between air and water.

The doctors concluded that giving surfactant improves the survival of babies born very early. Evaluate this conclusion.

Table with columns "Group", "Number of babies", "Number needing a mechanical ventilator at 72 hours", "Number that died within 28 days". Group: Surfactant; Number of babies: 140; Number needing a mechanical ventilator at 72 hours: 42; Number that died within 28 days: 14 | Group: Control (air); Number of babies: 120; Number needing a mechanical ventilator at 72 hours: 72; Number that died within 28 days: 30.

Model answer

Death rate with surfactant = 14 ÷ 140 = 0.10 (10%)
Death rate in control group = 30 ÷ 120 = 0.25 (25%)
Percentage reduction = (0.25 - 0.10) ÷ 0.25 × 100 = 60%

The phosphate head of a phospholipid is hydrophilic, so it stays in the water, while the two fatty acid tails are hydrophobic and point away from the water into the air. The phospholipids therefore form a single layer at the surface.

The death rate was less than half that of the control group (10% compared with 25%) and a smaller proportion needed a ventilator (30% compared with 60%), and the random allocation and the matching procedure in the control group make it likely that the surfactant caused the difference. However, no statistical test is given, so the difference may be due to chance, and only survival to 28 days was recorded.

Explanation

Phospholipids have a hydrophilic phosphate head and hydrophobic fatty acid tails, so at an air-water surface they form a single layer with the heads in the water; this is the same property that makes them form bilayers in membranes. To compare groups of different sizes, work out each death rate first, then the percentage reduction relative to the control rate. A good trial uses random allocation and a control group treated in the same way, but a conclusion still needs a statistical test.

Mark scheme
  1. 1 mark

    Correct method: death rates 14 ÷ 140 = 0.10 (10%) and 30 ÷ 120 = 0.25 (25%), then (0.25 - 0.10) ÷ 0.25 × 100; or a correct final answer of 60 with no working

    Max 6. Points 1 and 2 are the calculation: a correct answer of 60 (%) with no working scores 2 marks. Accept 60.0. Accept for 1 mark: 0.6 or 0.60 (not multiplied by 100) OR 150 (the difference divided by the surfactant death rate) OR evidence of both death rates (10% and 25%, or 0.10 and 0.25). Do not award either mark for 53 or 53.3 (from the numbers of deaths, 14 and 30, without allowing for the sizes of the groups).

  2. 1 mark

    60 (%)

    Accept 60.0.

  3. 1 mark

    The phosphate (head) is hydrophilic / attracted to water, so it is in the water

    Points 3 to 5: max 1.

  4. 1 mark

    The fatty acid (tails) are hydrophobic / repelled by water, so they point (away from the water) into the air

  5. 1 mark

    So the phospholipids form a single layer (monolayer) with the heads in the water and the tails in the air

  6. 1 mark

    (For) the death rate was less than half (10% compared with 25%)

    Points 6 to 11: max 3, with at most 2 marks from points 6 to 8 (for the conclusion) and at most 2 marks from points 9 to 11 (against it). Reject 'the results are significant'.

  7. 1 mark

    (For) a smaller proportion of babies needed a mechanical ventilator (30% compared with 60%)

  8. 1 mark

    (For) babies were allocated at random and the control babies had the same procedure (air through a tube), so the difference is likely to be due to the surfactant

  9. 1 mark

    (Against) no statistical test is given, so we do not know whether the difference is significant / could be due to chance

  10. 1 mark

    (Against) the doctors may have known which babies had surfactant (the trial may not have been blind), which could bias their care

  11. 1 mark

    (Against) only survival up to 28 days was recorded, so longer-term effects are not known

Question 2

7 marks

In some countries, food is cooked on open wood fires inside homes, and the smoke contains small particles and carbon monoxide. Scientists carried out a trial in one rural region. They randomly allocated homes with a child under 18 months old to two groups. One group was given a wood-burning stove with a chimney that takes smoke out of the house; the other group continued to use open fires. Over the next 18 months, doctors recorded every case of pneumonia, a lung infection, in the children. The scientists also measured carbon monoxide in each child's exhaled breath as a measure of exposure to smoke.

The table shows their results. A child-year is one child observed for one year. A statistical test showed that the difference in the rate of pneumonia was not significant (P = 0.09).

Calculate the number of cases of pneumonia per 100 child-years for each group.

In pneumonia, some alveoli fill with fluid and white blood cells. Explain why this reduces the uptake of oxygen into the blood.

The scientists concluded that replacing open fires with chimney stoves reduces pneumonia in young children. Evaluate this conclusion.

Table with columns "Group", "Number of children", "Total child-years observed", "Cases of pneumonia", "Mean carbon monoxide in exhaled breath / ppm". Group: Chimney stove; Number of children: 410; Total child-years observed: 530; Cases of pneumonia: 159; Mean carbon monoxide in exhaled breath / ppm: 2.4 | Group: Open fire; Number of children: 400; Total child-years observed: 525; Cases of pneumonia: 189; Mean carbon monoxide in exhaled breath / ppm: 4.6.

Model answer

Chimney stove: 159 ÷ 530 × 100 = 30 cases per 100 child-years
Open fire: 189 ÷ 525 × 100 = 36 cases per 100 child-years

When alveoli fill with fluid, fewer alveoli are ventilated, so the surface area for gas exchange is smaller, and the fluid increases the diffusion distance between the air and the blood. Less oxygen diffuses into the blood.

The rate of pneumonia was lower with chimney stoves (30 compared with 36 per 100 child-years), exposure to smoke was almost halved (carbon monoxide 2.4 compared with 4.6 ppm), and the homes were allocated at random. However, the difference was not significant (P = 0.09), so it may be due to chance. The families and doctors knew which group each child was in, and the children with stoves were still exposed to some smoke, so the conclusion is not fully supported.

Explanation

Rates per 100 child-years let groups observed for different total times be compared fairly. Gas exchange depends on a large surface area, a short diffusion distance and a steep concentration gradient, and fluid in the alveoli worsens all three. A randomised trial reduces the effect of other variables, but a difference with P > 0.05 is not significant, and a trial that is not blind can be biased. Always talk about the difference, not the results, being due to chance.

Mark scheme
  1. 1 mark

    Chimney stove: 30 (cases per 100 child-years) (159 ÷ 530 × 100; a correct answer with no working scores this mark)

    Max 6 if the evaluation gives only points for the conclusion or only points against it. Max 7. Points 1 and 2 are the calculation: each correct answer (30 for the chimney stove group and 36 for the open fire group) scores its mark with no working. Accept 30.0 and 36.0. If both values are given per child-year (0.30 and 0.36), award 1 mark in total.

  2. 1 mark

    Open fire: 36 (cases per 100 child-years) (189 ÷ 525 × 100)

  3. 1 mark

    Fewer alveoli are ventilated / the surface area for gas exchange is reduced

    Points 3 to 5: max 2.

  4. 1 mark

    The diffusion distance (between the air and the blood) is increased by the fluid

  5. 1 mark

    The concentration gradient of oxygen (between alveolar air and blood) is smaller, so less oxygen diffuses into the blood

  6. 1 mark

    (For) the rate of pneumonia was lower with chimney stoves (30 compared with 36 per 100 child-years, about 17% lower)

    Points 6 to 12: max 3. Reject 'the results are due to chance'.

  7. 1 mark

    (For) carbon monoxide in the breath was almost halved (2.4 compared with 4.6 ppm), so exposure to smoke was reduced

  8. 1 mark

    (For) homes were allocated at random, so other factors should be similar in the two groups

  9. 1 mark

    (Against) the difference was not significant (P = 0.09 is greater than 0.05), so it may be due to chance

    Accept 'the null hypothesis is not rejected' or 'the null hypothesis is accepted'. Reject 'the results are due to chance'.

  10. 1 mark

    (Against) families and doctors knew which group each child was in, which could bias the diagnosis / the trial was not blind

  11. 1 mark

    (Against) children with stoves were still exposed to some smoke (carbon monoxide in their breath was not zero, e.g. from neighbours' fires or the stove itself)

  12. 1 mark

    (Against) only one region was studied, so the results may not apply elsewhere

Question 3

8 marks

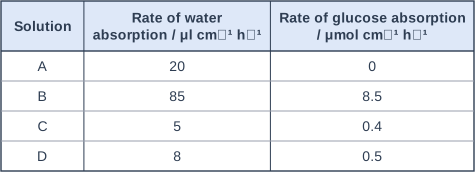
Scientists pumped solutions through short sections of the ileum of anaesthetised rats. They measured the rate at which water and glucose were absorbed from each solution. The solutions contained: A, sodium chloride; B, sodium chloride and glucose; C, glucose but no sodium ions; D, sodium chloride, glucose and an inhibitor of the sodium-potassium pump. All four solutions had the same water potential; where needed, a sugar that is not absorbed was added. The table shows the results.

Calculate the percentage increase in the rate of water absorption when glucose was added to the sodium chloride solution.

Explain why all four solutions had the same water potential.

Use your knowledge of co-transport to explain the results for solutions C and D.

Oral rehydration solutions, containing glucose and sodium chloride, are given to children who are losing water because of severe diarrhoea. Evaluate the use of these data to support this treatment.

Table with columns "Solution", "Rate of water absorption / μl cm⁻¹ h⁻¹", "Rate of glucose absorption / μmol cm⁻¹ h⁻¹". Solution: A; Rate of water absorption / μl cm⁻¹ h⁻¹: 20; Rate of glucose absorption / μmol cm⁻¹ h⁻¹: 0 | Solution: B; Rate of water absorption / μl cm⁻¹ h⁻¹: 85; Rate of glucose absorption / μmol cm⁻¹ h⁻¹: 8.5 | Solution: C; Rate of water absorption / μl cm⁻¹ h⁻¹: 5; Rate of glucose absorption / μmol cm⁻¹ h⁻¹: 0.4 | Solution: D; Rate of water absorption / μl cm⁻¹ h⁻¹: 8; Rate of glucose absorption / μmol cm⁻¹ h⁻¹: 0.5.

Model answer

Percentage increase = (85 - 20) ÷ 20 × 100 = 325%

The solutions had the same water potential so that any difference in water absorption was caused by the solutes being absorbed, not by different water potential gradients between the solutions and the cells.

Glucose enters the epithelial cells together with sodium ions through a co-transport protein. In solution C there are no sodium ions, so very little glucose is absorbed. The sodium-potassium pump normally uses ATP to transport sodium ions out of the epithelial cells into the blood, keeping their concentration in the cells low. In solution D the pump is inhibited, so there is no sodium ion gradient into the cells and co-transport of glucose almost stops. In both C and D little solute is absorbed, so the water potential of the cells and blood is not lowered and little water follows by osmosis.

The data support the treatment, because sodium chloride with glucose (B) gave about four times as much water absorption as sodium chloride alone. However, these were healthy, anaesthetised rats, not children with diarrhoea, and only one glucose concentration was tested; too much glucose could draw water into the gut by osmosis.

Explanation

In the ileum, glucose is absorbed by co-transport with sodium ions, which depends on the sodium-potassium pump keeping the sodium concentration inside the epithelial cells low. Absorbing solutes lowers the water potential of the cells and blood, so water follows by osmosis: this is the basis of oral rehydration solutions. Keeping the water potential of the solutions the same is a control, so that only solute absorption can explain the differences. Data from healthy animals must be applied to patients with care.

Mark scheme
  1. 1 mark

    Correct method: (85 - 20) ÷ 20 × 100; or a correct final answer of 325 with no working

    Max 8. Points 1 and 2 are the calculation: a correct answer of 325 (%) with no working scores 2 marks. Accept for 1 mark: 3.25 (not multiplied by 100) OR 425 (85 ÷ 20 × 100) OR 76.5 (the increase divided by 85).

  2. 1 mark

    325 (%)

  3. 1 mark

    So that differences in water absorption are due to the absorption of solutes / the different solutes, not to different water potential gradients between the solutions and the cells / blood

    Point 3: 1 mark. Accept 'as a control variable, so that water potential does not affect the movement of water'. Insufficient: 'to make it a fair test'.

  4. 1 mark

    Glucose is absorbed (into epithelial cells) with sodium ions through a co-transport protein, so without sodium ions in the lumen (C) little glucose is absorbed

    Points 4 to 7: max 2.

  5. 1 mark

    The sodium-potassium pump actively transports sodium ions out of the epithelial cells into the blood (using ATP), keeping the sodium ion concentration in the cells low

  6. 1 mark

    When the pump is inhibited (D), there is no / a smaller sodium ion concentration gradient into the cells, so co-transport of glucose stops / is reduced

  7. 1 mark

    Less solute is absorbed, so the water potential of the cells / blood is not lowered, so less water is absorbed by osmosis (in C and D)

  8. 1 mark

    (For) solution B, with sodium chloride and glucose, gave the fastest water absorption, about four times that with sodium chloride alone

    Points 8 to 11: max 3, with at most 1 mark from point 8 (for the use of the data) and at most 2 marks from points 9 to 11 (against it).

  9. 1 mark

    (Against) the data are from rats, not children / anaesthetised animals

  10. 1 mark

    (Against) the ileum was healthy; in diarrhoea the gut lining may be damaged / may be secreting water

  11. 1 mark

    (Against) only one concentration of glucose was tested; too much glucose would lower the water potential in the gut and draw water out of the cells by osmosis

Question 4

9 marks

A snorkel is a tube that lets a swimmer breathe with their face under water. After each breath out, the airways and the snorkel are left full of air that has just been breathed out, and this air is the first to be breathed in again. The volume of these tubes is called the dead space.

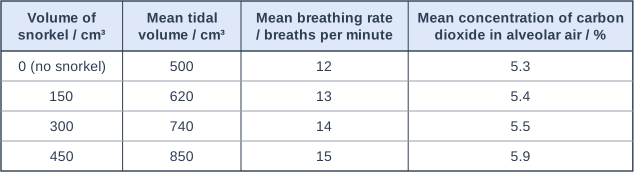
Scientists investigated the effect of breathing through snorkels with different internal volumes. Twelve adult volunteers sat at rest and breathed through each snorkel, in a random order. The scientists made their measurements after each volunteer had breathed through a snorkel for 10 minutes. The table shows the mean results.

Alveolar ventilation (the volume of fresh air reaching the alveoli each minute) = (tidal volume - dead space) × breathing rate, where the dead space is 150 cm³ plus the volume of the snorkel.

Calculate the alveolar ventilation with the 450 cm³ snorkel. Give your answer in dm³ min⁻¹.

Explain why the concentration of carbon dioxide in the alveolar air increased as the volume of the snorkel increased.

Suggest why the scientists waited until each volunteer had breathed through a snorkel for 10 minutes before making their measurements.

A safety organisation recommends that snorkels for children should have a volume of no more than 150 cm³. Use the data and your own knowledge to evaluate this recommendation.

Table with columns "Volume of snorkel / cm³", "Mean tidal volume / cm³", "Mean breathing rate / breaths per minute", "Mean concentration of carbon dioxide in alveolar air / %". Volume of snorkel / cm³: 0 (no snorkel); Mean tidal volume / cm³: 500; Mean breathing rate / breaths per minute: 12; Mean concentration of carbon dioxide in alveolar air / %: 5.3 | Volume of snorkel / cm³: 150; Mean tidal volume / cm³: 620; Mean breathing rate / breaths per minute: 13; Mean concentration of carbon dioxide in alveolar air / %: 5.4 | Volume of snorkel / cm³: 300; Mean tidal volume / cm³: 740; Mean breathing rate / breaths per minute: 14; Mean concentration of carbon dioxide in alveolar air / %: 5.5 | Volume of snorkel / cm³: 450; Mean tidal volume / cm³: 850; Mean breathing rate / breaths per minute: 15; Mean concentration of carbon dioxide in alveolar air / %: 5.9.

Model answer

Dead space with the 450 cm³ snorkel = 150 + 450 = 600 cm³
Alveolar ventilation = (850 - 600) × 15 = 3750 cm³ min⁻¹ = 3.75 dm³ min⁻¹

The first air breathed in comes from the snorkel and has just been breathed out, so it has a high concentration of carbon dioxide. Although the volunteers breathed more deeply and faster, less fresh air reached the alveoli each minute (3.75 dm³ min⁻¹ compared with 4.2 dm³ min⁻¹ without a snorkel), so carbon dioxide was removed from the alveoli more slowly than it diffused in from the blood.

The scientists waited 10 minutes so that each volunteer's breathing, and the concentration of carbon dioxide in the alveolar air, had time to adjust to the new snorkel and become steady.

For adults the data support the limit: the 150 cm³ snorkel reduced alveolar ventilation by only about 1% (4.2 to 4.16 dm³ min⁻¹) and raised carbon dioxide only from 5.3% to 5.4%, while larger snorkels had much bigger effects. However, the volunteers were adults at rest. Children have smaller tidal volumes, so 150 cm³ would be a larger fraction of each breath and could reduce their alveolar ventilation much more, and swimming increases the demand for oxygen. Only 12 volunteers were tested and no statistical test was used, so the limit for children may need to be lower.

Explanation

Only air that reaches the alveoli takes part in gas exchange, so the dead space is subtracted from each breath; a snorkel adds to the dead space, and the air in it has just been breathed out. The volunteers compensated by breathing more deeply and faster, but not completely, so carbon dioxide built up in the alveolar air. Add the snorkel volume to the 150 cm³ before calculating, and divide by 1000 to convert cm³ to dm³; tidal volume × breathing rate gives the pulmonary ventilation rate, which rose. When evaluating a safety limit, ask whether the people tested (adults at rest) match the people it is meant for (children swimming).

Mark scheme
  1. 1 mark

    Correct method: dead space = 150 + 450 = 600 cm³, then (850 - 600) × 15 = 3750 (cm³ min⁻¹); or a correct final answer of 3.75 dm³ min⁻¹ with no working

    Max 8 if the evaluation gives only points for the recommendation or only points against it. Max 9. Points 1 and 2 are the calculation: a correct answer of 3.75 dm³ min⁻¹ (accept 3.8) with no working scores 2 marks. Accept for 1 mark: 3750 (correct value in cm³ min⁻¹, not converted to dm³). Do not award either mark for 10.5 or 10 500 (the snorkel left out of the dead space) or 12.75 or 12 750 (tidal volume × breathing rate, the pulmonary ventilation rate).

  2. 1 mark

    3.75 (dm³ min⁻¹)

    Accept 3.8. Do not award this mark for 3750 (not converted to dm³), but award point 1.

  3. 1 mark

    The first air breathed in is air from the snorkel / dead space that has just been breathed out, so it has a high concentration of carbon dioxide (and a low concentration of oxygen)

    Points 3 to 5: max 2.

  4. 1 mark

    Less fresh air reaches the alveoli each minute / alveolar ventilation decreased (from 4.2 dm³ min⁻¹ without a snorkel to 3.75 dm³ min⁻¹) even though the volunteers breathed more deeply and faster

    Accept correct alveolar ventilations for the other snorkels (4.16 and 4.06 dm³ min⁻¹, or 4160 and 4060 cm³ min⁻¹).

  5. 1 mark

    So carbon dioxide is removed from the alveoli more slowly than it diffuses in from the blood / the concentration gradient of carbon dioxide between the blood and the alveolar air is not maintained as well

    Insufficient: 'less gas exchange' with no reference to carbon dioxide or the concentration gradient.

  6. 1 mark

    So that breathing (tidal volume and breathing rate) / the concentration of carbon dioxide in the alveolar air had time to adjust to the new snorkel and become steady (constant)

    Point 6: 1 mark. Accept 'so that the effect of the previous snorkel had worn off'. Insufficient: 'to get accurate results' or 'to make it fair' with no reason.

  7. 1 mark

    (For) in these adults the 150 cm³ snorkel had little effect: alveolar ventilation fell by only about 1% (4.2 to 4.16 dm³ min⁻¹) and carbon dioxide rose only from 5.3% to 5.4%, while larger snorkels had bigger effects (5.9% at 450 cm³)

    Points 7 to 11: max 4.

  8. 1 mark

    (Against) the volunteers were adults: children have smaller tidal volumes, so 150 cm³ would be a larger fraction of each breath and would reduce their alveolar ventilation more, so the limit may be too high for children

    Accept 'children have smaller lungs / a smaller dead space' if linked to a greater effect of the same snorkel volume.

  9. 1 mark

    (Against) the volunteers were at rest: when swimming, the demand for oxygen / production of carbon dioxide is greater

  10. 1 mark

    (Against) only 12 volunteers were tested / only mean values are given

  11. 1 mark

    (Against) no statistical test was used, so the differences between 0 and 150 cm³ may be due to chance

    Reject 'the results are due to chance'.

Ready to try the rest? Every answer you write is marked against the mark scheme, so you can see exactly where the marks are.

Study Helper Hints first, answers after you try

Stuck on this one? Ask for a hint and I’ll point you in the right direction, without giving the answer away. Once you’ve checked your answer, I’ll show you how the marks are awarded.