
Level:
Correct: 0
Incorrect: 0
Marks: 0/0
Exam Practice
Course:
Topics:
AQA A-Level Biology (Paper 3) Smart practice A mixed round aimed at your weak spots
Unit 1
Required practical activities
Unit 2
Practical and mathematical skills
Unit 3
Critical analysis of experimental data
Unit 4
The essay
Avg
score:
–
Topics
done:
0/26

Choosing and using statistical tests

Practise 18 exam-style questions on Choosing and using statistical tests for AQA A-Level Biology (Paper 3). Write your answer as you would in the exam and get it marked in seconds against the mark scheme, point by point, with the Study Helper on hand if you get stuck.

  • 18 questions
  • 1–7 marks each
  • Instant marking
  • No sign-up needed
18 questions, marked as you go

Sample questions with model answers

Here are 4 of the questions in this topic, each with a model answer, an explanation of why it earns the marks and the mark scheme an examiner would use.

Question 1

2 marks

Scientists treated 20 wheat seedlings with a product that is claimed to stimulate root growth, and kept 20 untreated seedlings as a control. They used Student's t-test to compare the mean root lengths of the two groups and obtained P = 0.23.

A student wrote: 'This means there is a 23% chance that the results are wrong.'

Explain what is wrong with the student's statement and what P = 0.23 tells you about these data.

Model answer

P is not the probability that the results are wrong; the results may have been measured perfectly. P = 0.23 means that there is a 23% probability that the difference between the mean root lengths is due to chance. This is greater than 0.05, so the difference is not significant and the null hypothesis is not rejected: these data give no evidence that the product stimulates root growth.

Explanation

A P value is the probability that a difference (or correlation) as large as the one observed is due to chance. It says nothing about whether measurements are correct. A difference is significant only if P is 0.05 or less. Statements about results being wrong, or results being due to chance, are not credited.

Mark scheme
  1. 1 mark

    P is the probability that the difference between the means is due to chance (23%), not the probability that the results are wrong

    Accept "there is a 23% probability that a difference this large would occur by chance (if the product had no effect)".

  2. 1 mark

    0.23 is greater than 0.05, so the difference between the mean root lengths is not significant / the null hypothesis is not rejected / there is no evidence that the product stimulates root growth

    Accept "the null hypothesis is accepted" for "not rejected" (credited in AQA's 7402/2 June 2024 mark scheme), although "not rejected" is the better wording. Reject "the results are due to chance", "the results are (not) significant" or "the results are (not) due to chance": it is the difference (or correlation) that may be due to chance.
Question 2

3 marks

An ecologist recorded where a species of moss grew on 80 tree trunks in an area of open parkland. For each tree, she recorded whether the largest patch of the moss was on the north, east, south or west side of the trunk.

Give a suitable null hypothesis for her investigation.

The largest patch was on the north side of 31 trees, the east side of 18, the south side of 12 and the west side of 19. A chi-squared test showed that the difference between these numbers and the expected numbers was significant at P = 0.05.

She concluded: 'This moss grows best on the north side of tree trunks because the north side is shadier and damper.' Evaluate her conclusion.

Model answer

Null hypothesis: there is no difference between the numbers of trees with the largest patch of moss on the north, east, south and west sides of the trunk (the side of the trunk has no effect on where the moss grows).

The north side had the largest patch on 31 trees, compared with 20 expected, and the chi-squared test shows that this difference is unlikely to be due to chance, which supports the idea that the moss is commoner on the north side. However, she did not measure shade or moisture, so the reason she gives has not been tested; another factor, such as the direction of the prevailing wind and rain, could explain it. She also recorded only which side had the largest patch, not how much moss grew, so she has not shown that it grows best there.

Explanation

A null hypothesis states that there is no difference or no effect, in the context of the investigation; a general one about observed and expected results is not enough. A significant chi-squared result shows only that the numbers differ from those expected by more than chance would explain: it does not show the cause, and the conclusion must match what was actually measured (here, the side with the largest patch, not growth).

Mark scheme
  1. 1 mark

    There is no difference between the numbers of trees with the largest patch of moss on the north, east, south and west sides / the side of the trunk has no effect on where the moss grows / the moss shows no preference for any side of the trunk

    Max 3. The null hypothesis must refer to the side of the trunk and the moss. Ignore 'significant'. Reject 'there is no difference between the observed and expected results' on its own. Reject a hypothesis, e.g. 'the moss grows best on the north side'.

  2. 1 mark

    (Supports) the largest patch was on the north side of more trees than expected (31 compared with 20), and the difference is significant / unlikely to be due to chance

    Points 2 to 6: max 2, with at most 1 mark from point 2 (for the conclusion) and at most 1 mark from points 3 to 6 (against it). Reject 'the results are significant' or 'the results are not due to chance': it is the difference that is or is not due to chance.

  3. 1 mark

    (Against) shade / light intensity and moisture / humidity were not measured, so the reason she gives has not been tested

    Accept 'a significant difference does not show the cause'.

  4. 1 mark

    (Against) another factor that differs between the sides of the trunk could explain the pattern, e.g. the direction of the prevailing wind or rain

    Ignore 'other factors' unless one is named.

  5. 1 mark

    (Against) she recorded only which side had the largest patch, not the amount / area / growth of moss, so she has not shown where it grows best

  6. 1 mark

    (Against) the trees were in one area (of open parkland) / of unknown species, so the result may not apply to other places or trees

    Ignore 'small sample' unqualified.

Question 3

3 marks

Explain what is meant by the critical value in a statistical test.

Explain why a statistical test can never prove that a hypothesis is true.

Model answer

The critical value is the value of the test statistic (χ², t or rs) that corresponds to a probability of 0.05 for the degrees of freedom (or number of pairs) in the investigation. If the calculated value is equal to or greater than the critical value, the difference or correlation is significant and the null hypothesis is rejected.

A statistical test only tests the null hypothesis, which is either rejected or not rejected. Even when the result is significant there is still a probability of up to 5% that the difference or correlation is due to chance, so the test can support a hypothesis but never prove it.

Explanation

Statistical tests work by testing a null hypothesis. AQA's practical handbook makes the point that a test either disproves or fails to disprove the null hypothesis and can never prove a hypothesis to be true. P = 0.05 is the agreed level at which a difference is called significant.

Mark scheme
  1. 1 mark

    The value of the test statistic (e.g. χ², t or rs) at a probability of 0.05 for the given degrees of freedom / number of pairs

    Max 3.

  2. 1 mark

    If the calculated value is equal to or greater than the critical value, the difference / correlation is significant and the null hypothesis is rejected

  3. 1 mark

    A test only shows whether the null hypothesis is rejected or not rejected / it gives the probability that a difference or correlation is due to chance

    Accept "the null hypothesis is accepted or rejected" (the practical handbook speaks of acceptance or rejection of a null hypothesis).

  4. 1 mark

    Even a significant difference or correlation has a probability (of up to 5%) of being due to chance

    Accept "a significant result supports the hypothesis but does not prove it". Reject "the results may be due to chance".

Question 4

5 marks

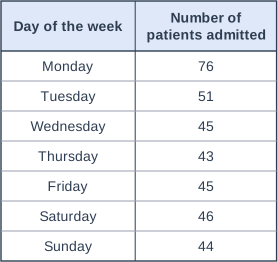
Hospital records showed the day of the week on which 350 patients were admitted with a heart attack. The table shows the results. The expected number for each day, if admissions were equally likely on every day, is 50.

Calculate the value of χ² for these data. Use the formula:
χ² = Σ (O - E)² ÷ E
where O = observed number and E = expected number.

Critical values of χ² at P = 0.05:
5 degrees of freedom: 11.07
6 degrees of freedom: 12.59
7 degrees of freedom: 14.07

Use your value of χ² to say what you can conclude from these data. Use the terms probability and chance in your answer.

A newspaper claimed that these data show that the stress of returning to work after the weekend causes heart attacks. Give one reason why the data do not show this.

Table with columns "Day of the week", "Number of patients admitted". Day of the week: Monday; Number of patients admitted: 76 | Day of the week: Tuesday; Number of patients admitted: 51 | Day of the week: Wednesday; Number of patients admitted: 45 | Day of the week: Thursday; Number of patients admitted: 43 | Day of the week: Friday; Number of patients admitted: 45 | Day of the week: Saturday; Number of patients admitted: 46 | Day of the week: Sunday; Number of patients admitted: 44.

Model answer

Values of (O - E)² ÷ E: Monday (76 - 50)² ÷ 50 = 13.52; Tuesday 0.02; Wednesday 0.5; Thursday 0.98; Friday 0.5; Saturday 0.32; Sunday 0.72
χ² = 13.52 + 0.02 + 0.5 + 0.98 + 0.5 + 0.32 + 0.72 = 16.56

There are 7 categories, so 7 - 1 = 6 degrees of freedom and the critical value is 12.59. 16.56 is greater than 12.59, so the difference between the observed and expected numbers is significant and the null hypothesis (admissions are equally likely on every day) is rejected. The probability that this difference is due to chance is less than 5%; there were more admissions on Mondays than expected.

The data do not show that stress causes heart attacks: they show only that more people were admitted on Mondays. Stress was not measured, and some heart attacks that happened at the weekend may not have been admitted until Monday.

Explanation

For χ², degrees of freedom = number of categories - 1, here 7 - 1 = 6. If the calculated value is greater than or equal to the critical value at P = 0.05, the probability that the difference between observed and expected is due to chance is 5% or less, so it is significant. Most of this χ² value comes from Monday. Always say that the difference, not the results, is or is not due to chance. A significant result shows that the pattern is unlikely to be due to chance, not what causes it.

Mark scheme
  1. 1 mark

    Correct method: (O - E)² ÷ E calculated for each day and added, e.g. 13.52 + 0.02 + 0.5 + 0.98 + 0.5 + 0.32 + 0.72; or a correct final answer of 16.56 (accept 16.5 to 16.6) with no working

    Max 5. A correct value of 16.56 (accept 16.5 to 16.6) with no working scores 2 marks (points 1 and 2). Accept for 1 mark: correct (O - E)² ÷ E values for at least five days, with an error in the rest of the calculation.

  2. 1 mark

    χ² = 16.56 (accept 16.5 to 16.6)

  3. 1 mark

    6 degrees of freedom AND 16.56 is greater than the critical value of 12.59, so the difference (between the observed and expected numbers) is significant / the null hypothesis is rejected

    ECF: accept a correct comparison of the student's value of χ² with 12.59. Do not award this mark if 5 or 7 degrees of freedom are used. Reject "the results are due to chance", "the results are (not) significant" or "the results are (not) due to chance": it is the difference (or correlation) that may be due to chance.

  4. 1 mark

    The probability that the difference (between the observed and expected numbers) is due to chance is less than 0.05 / 5%

    Accept "more than 95% probability that the difference is not due to chance". Reject "the results are due to chance", "the results are (not) significant" or "the results are (not) due to chance": it is the difference (or correlation) that may be due to chance.

  5. 1 mark

    The data show only that more people were admitted on Mondays (an association), not what caused it / stress (or work) was not measured

    Points 5 to 8: max 1. List rule: if more than one reason is given, a wrong or contradictory extra answer cancels the correct one. Accept 'correlation does not show causation' only if linked to Monday or stress.

  6. 1 mark

    Some heart attacks that happened at the weekend may not have been admitted until Monday / people may delay going to hospital at the weekend

  7. 1 mark

    There is no information on whether the patients worked / many of the patients may not work (e.g. are retired)

  8. 1 mark

    Another factor that differs between days could explain it, e.g. eating or drinking more alcohol at the weekend

    Ignore 'other factors' unless one is named.

Ready to try the rest? Every answer you write is marked against the mark scheme, so you can see exactly where the marks are.

Study Helper Hints first, answers after you try

Stuck on this one? Ask for a hint and I’ll point you in the right direction, without giving the answer away. Once you’ve checked your answer, I’ll show you how the marks are awarded.