
Level:
Correct: 0
Incorrect: 0
Marks: 0/0
Exam Practice
Course:
Topics:
AQA A-Level Biology (Paper 3) Smart practice A mixed round aimed at your weak spots
Unit 1
Required practical activities
Unit 2
Practical and mathematical skills
Unit 3
Critical analysis of experimental data
Unit 4
The essay
Avg
score:
–
Topics
done:
0/26

Required practical 11: glucose calibration curve

Practise 16 exam-style questions on Required practical 11: glucose calibration curve for AQA A-Level Biology (Paper 3). Write your answer as you would in the exam and get it marked in seconds against the mark scheme, point by point, with the Study Helper on hand if you get stuck.

  • 16 questions
  • 1–8 marks each
  • Instant marking
  • No sign-up needed
16 questions, marked as you go

Sample questions with model answers

Here are 4 of the questions in this topic, each with a model answer, an explanation of why it earns the marks and the mark scheme an examiner would use.

Question 1

2 marks

A student used a glucose oxidase reagent, which forms a coloured product with glucose, and a colorimeter to produce the calibration curve shown in the graph. The colorimeter displays absorbance to two decimal places.

Explain why she can estimate the glucose concentration of a sample more precisely when its absorbance is 0.40 than when its absorbance is 1.20.
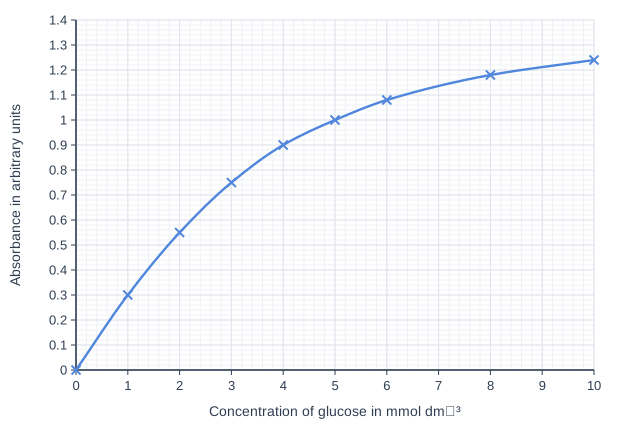
Line graph of absorbance in arbitrary units (y-axis, 0 to 1.4) against concentration of glucose in mmol dm⁻³ (x-axis, 0 to 10). The line is a smooth curve through (0, 0), (1, 0.3), (2, 0.55), (3, 0.75), (4, 0.9), (5, 1), (6, 1.08), (8, 1.18), (10, 1.24).

Model answer

The curve is steep at an absorbance of 0.40 but almost flat at 1.20. On the steep part, a small uncertainty in the absorbance reading, such as ± 0.02, corresponds to only a small range of glucose concentrations: 0.38 to 0.42 covers about 1.3 to 1.5 mmol dm⁻³. On the flat part, the same uncertainty corresponds to a much larger range: 1.18 to 1.22 covers about 8 to 9.3 mmol dm⁻³. So the estimate at 1.20 is much less precise.

Explanation

The precision of a value read from a calibration curve depends on its gradient: where absorbance changes a lot for a small change in concentration, the reading pins the concentration down closely. Where the curve flattens, the reagent is close to being used up, so extra glucose makes little difference to the colour and the method becomes insensitive. This is why samples are diluted so that they fall on the steep part of the curve.

Mark scheme
  1. 1 mark

    The curve is (much) steeper at an absorbance of 0.40 (low concentrations) than at 1.20, where it is almost flat

    Accept 'the gradient is greater at 0.40'.

  2. 1 mark

    So a small change / uncertainty in absorbance (e.g. ± 0.01 or ± 0.02) corresponds to a much smaller range of concentrations at 0.40 than at 1.20

    Accept a correct numerical illustration read from the graph, e.g. ± 0.02 in absorbance covers about 1.3 to 1.5 mmol dm⁻³ at 0.40 but about 8 to 9.3 mmol dm⁻³ at 1.20.
Question 2

3 marks

A technician found an old bottle of glucose solution labelled '200 mmol dm⁻³'. A student checked its concentration with a glucose oxidase reagent and a colorimeter. Her calibration curve was a straight line from 0 to 5.0 mmol dm⁻³ glucose.

She diluted 1.0 cm³ of the solution from the bottle to 50 cm³ with distilled water. She tested one sample of the diluted solution and read a glucose concentration of 3.8 mmol dm⁻³ from her calibration curve. She calculated that the bottle contained 190 mmol dm⁻³ glucose, and concluded that microorganisms in the bottle had used some of the glucose.

Evaluate her conclusion.

Model answer

Her value of 190 mmol dm⁻³ is lower than the 200 mmol dm⁻³ on the label, which fits some of the glucose having been used. However, the difference is only 10 mmol dm⁻³ (5%), and any error in reading her calibration curve is multiplied by 50: an error of only 0.1 mmol dm⁻³ in the reading gives an error of 5 mmol dm⁻³ in the bottle. She tested only one sample, so she cannot tell whether the difference is real, and she did not test the solution for microorganisms, so there is no evidence that they used the glucose.

Explanation

Evaluating a conclusion means weighing the evidence for it against the limitations of the data. A small difference from an expected value can be caused by errors in the method, and when a sample is diluted to fit a calibration curve, any error in the reading is multiplied by the dilution factor. Repeat tests, a freshly made solution of known concentration tested in the same way, and a direct test for microorganisms would all be needed to support this conclusion.

Mark scheme
  1. 1 mark

    Supports: 190 mmol dm⁻³ is lower than the labelled 200 mmol dm⁻³, which fits some of the glucose having been used

    Max 3. Point 1 supports the conclusion (max 1). Points 2 to 7 are against it: max 2 from points 2 to 7. Ignore 'she used a calibration curve, so the result is accurate'.

  2. 1 mark

    The difference is small (10 mmol dm⁻³ / 5%), so it could be caused by errors in the method (e.g. in the dilution or in reading the calibration curve) rather than by a real loss of glucose

    Accept 'the difference may be within the uncertainty of the method'.

  3. 1 mark

    Any error in the reading from the calibration curve is multiplied by 50 (the dilution factor), e.g. an error of 0.1 mmol dm⁻³ in the reading gives an error of 5 mmol dm⁻³ in the bottle

    Accept a correct numerical example.

  4. 1 mark

    She tested only one sample / did not repeat the dilution and the test, so she cannot tell whether the difference is real

    Accept 'no repeats, so no measure of variation'.

  5. 1 mark

    She did not test for microorganisms (e.g. cloudiness, or growth of colonies on agar), so there is no evidence that they caused any loss of glucose

  6. 1 mark

    The solution may not have contained exactly 200 mmol dm⁻³ when it was made / the label may not be accurate

  7. 1 mark

    She did not test a freshly made solution of known concentration (e.g. 200 mmol dm⁻³) in the same way, to check her method

    Accept 'her standards may have been made inaccurately, so the calibration curve may be wrong'.

Question 3

3 marks

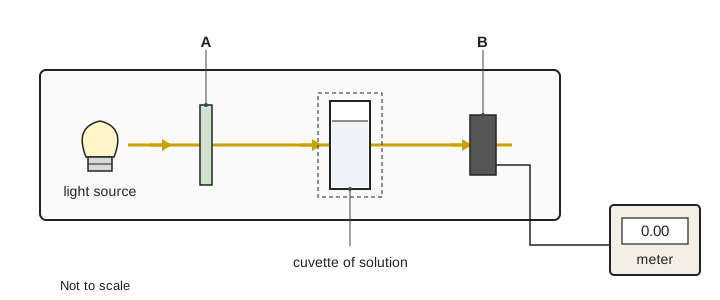
The diagram shows how a colorimeter works.

Name the parts labelled A and B.

The cuvette holder has a lid that closes over the cuvette. A student took her readings with the lid open, in a brightly lit laboratory. Explain how this would affect her absorbance readings.

Diagram of a colorimeter, not to scale. Inside a case, a beam of light from a light source on the left passes through a thin vertical plate labelled A, then through a cuvette of solution standing in a holder, then into a dark box labelled B. A wire from B leads to a meter outside the case showing 0.00.

Model answer

A is the filter and B is the light detector (photocell).

With the lid open, light from the room reaches the detector as well as the light from the lamp that has passed through the solution. The detector receives more light than it should, so the colorimeter records an absorbance that is lower than the true value, and the readings change as the lighting in the room changes.

Explanation

In a colorimeter, light passes through a coloured filter, then through the solution in the cuvette, to a detector (photocell) connected to a meter. Absorbance is worked out from how much less light reaches the detector than with the blank, so the detector must receive only light from the lamp that has passed through the sample. Stray light from the room makes the absorbance too low; anything that blocks light in the beam, such as fingerprints or bubbles, makes it too high.

Mark scheme
  1. 1 mark

    A: (coloured) filter

    Reject lens or prism.

  2. 1 mark

    B: (light) detector / photocell / photodiode / light sensor

    Accept 'photoelectric cell'. Reject 'meter' (the meter is drawn separately).

  3. 1 mark

    Light from the room reaches the detector (B) as well as light that has passed through the solution, so more light is detected and the absorbance readings are too low (and vary with the room lighting)

    Both the extra light reaching the detector and the effect on the readings (too low, or varying) are needed. Do not accept 'the absorbance would be too high'.

Question 4

6 marks

You are provided with:
- 10 mmol dm⁻³ glucose solution
- distilled water
- Benedict's solution
- a sample of artificial 'urine'
- test tubes, graduated pipettes, a water bath at 90 °C, a colorimeter and cuvettes.

Describe how you would use these to find the concentration of glucose in the 'urine'. Include in your answer the volumes you would use to make 10.0 cm³ of a 6.0 mmol dm⁻³ glucose solution.

Model answer

1. Make glucose solutions of 0, 2, 4, 6, 8 and 10 mmol dm⁻³ by diluting the 10 mmol dm⁻³ solution with distilled water. For 10.0 cm³ of 6.0 mmol dm⁻³, mix 6.0 cm³ of 10 mmol dm⁻³ glucose with 4.0 cm³ of distilled water.
2. Put 2 cm³ of each glucose solution and 2 cm³ of the 'urine' into separate test tubes, and add 2 cm³ of Benedict's solution to each.
3. Heat all the tubes together in the water bath at 90 °C for 5 minutes, then let them cool.
4. Zero the colorimeter with a blank and use a red filter. Measure the absorbance of each standard three times and calculate the means.
5. Plot mean absorbance (y-axis) against glucose concentration (x-axis) and draw a curve of best fit.
6. Measure the absorbance of the 'urine', which was treated in exactly the same way, and read its glucose concentration from the calibration curve.

Explanation

The method has three stages: make standards of known concentration by dilution, treat the standards and the unknown identically (same volumes of sample and reagent, same heating time and temperature), and measure each with a correctly zeroed colorimeter. The calibration curve plots absorbance against known concentration, and the unknown's concentration is read from it. For a dilution from 10 to 6.0 mmol dm⁻³, the volume of stock is 6.0 ÷ 10 × 10.0 = 6.0 cm³. Write 'volume', not 'amount'.

Mark scheme
  1. 1 mark

    Dilute the 10 mmol dm⁻³ glucose with distilled water to make a range of (at least five) known concentrations, e.g. 0, 2, 4, 6, 8 and 10 mmol dm⁻³

    Max 5 if the answer does not give both volumes (glucose solution and distilled water) for the dilution the question asks for. Max 6.

  2. 1 mark

    6.0 mmol dm⁻³: 6.0 cm³ of 10 mmol dm⁻³ glucose AND 4.0 cm³ of distilled water

    Both volumes are needed.

  3. 1 mark

    Add the same volume of Benedict's solution to the same volume of each glucose solution and of the 'urine'

    Do not accept 'amount' for volume. Accept 'equal volumes'.

  4. 1 mark

    Heat all the tubes in the water bath for the same time (e.g. 5 minutes)

  5. 1 mark

    Zero / calibrate the colorimeter with a blank (e.g. distilled water or the 0 mmol dm⁻³ tube)

  6. 1 mark

    Measure the absorbance (or transmission) of each standard with the colorimeter (using a red / orange filter)

    Reject calorimeter.

  7. 1 mark

    Plot absorbance against glucose concentration (concentration on the x-axis) and draw a line or curve of best fit (the calibration curve)

    Do not accept absorbance on the x-axis.

  8. 1 mark

    Treat the 'urine' in exactly the same way and measure its absorbance

  9. 1 mark

    Read the glucose concentration of the 'urine' from the calibration curve at its absorbance

    Accept 'read across from the absorbance to the curve, then down to the concentration axis'.

  10. 1 mark

    Repeat each measurement (at least three times) and use the mean

Ready to try the rest? Every answer you write is marked against the mark scheme, so you can see exactly where the marks are.

Study Helper Hints first, answers after you try

Stuck on this one? Ask for a hint and I’ll point you in the right direction, without giving the answer away. Once you’ve checked your answer, I’ll show you how the marks are awarded.