Level:
Correct: 0
Incorrect: 0
Marks: 0/0
Exam Practice
Course:
Topics:
AQA A-Level Biology (Paper 3) Smart practice A mixed round aimed at your weak spots
Unit 1
Required practical activities
Unit 2
Practical and mathematical skills
Unit 3
Critical analysis of experimental data
Unit 4
The essay
Avg
score:
–
Topics
done:
0/26

Data analysis: biological molecules and cells

Practise 14 exam-style questions on Data analysis: biological molecules and cells for AQA A-Level Biology (Paper 3). Write your answer as you would in the exam and get it marked in seconds against the mark scheme, point by point, with the Study Helper on hand if you get stuck.

  • 14 questions
  • 5–9 marks each
  • Instant marking
  • No sign-up needed
14 questions, marked as you go

Sample questions with model answers

Here are 4 of the questions in this topic, each with a model answer, an explanation of why it earns the marks and the mark scheme an examiner would use.

Question 1

6 marks

Newborn calves have very few antibodies in their blood. They obtain antibodies from colostrum, the first milk produced by their mother. For a short time after birth, cells lining the calf's small intestine can absorb whole antibody molecules, but this ability decreases with time.

Farm scientists fed four groups of 12 newborn calves the same volume of colostrum at different times after birth. They measured the concentration of antibodies in each calf's blood 48 hours after birth. They also recorded how many calves in each group developed a gut infection during their first month. The table shows their results.

Calculate the percentage decrease in the mean concentration of antibodies when colostrum was fed at 24 hours compared with 1 hour. Give your answer to 2 significant figures.

Explain why the antibodies from colostrum give calves only short-term protection against infection.

A farmer concluded that feeding colostrum within 1 hour of birth prevents gut infections in calves. Evaluate this conclusion.
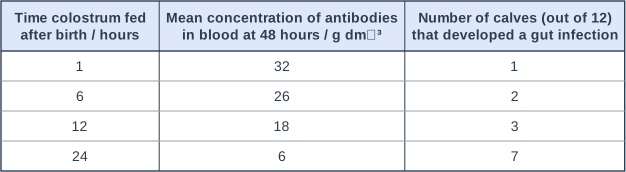
Table with columns "Time colostrum fed after birth / hours", "Mean concentration of antibodies in blood at 48 hours / g dm⁻³", "Number of calves (out of 12) that developed a gut infection". Time colostrum fed after birth / hours: 1; Mean concentration of antibodies in blood at 48 hours / g dm⁻³: 32; Number of calves (out of 12) that developed a gut infection: 1 | Time colostrum fed after birth / hours: 6; Mean concentration of antibodies in blood at 48 hours / g dm⁻³: 26; Number of calves (out of 12) that developed a gut infection: 2 | Time colostrum fed after birth / hours: 12; Mean concentration of antibodies in blood at 48 hours / g dm⁻³: 18; Number of calves (out of 12) that developed a gut infection: 3 | Time colostrum fed after birth / hours: 24; Mean concentration of antibodies in blood at 48 hours / g dm⁻³: 6; Number of calves (out of 12) that developed a gut infection: 7.

Model answer

Percentage decrease = (32 - 6) ÷ 32 × 100 = 26 ÷ 32 × 100 = 81.25 = 81%

This is passive immunity: the antibodies were made by the mother, not by the calf. The calf's own B cells are not activated, so no plasma cells or memory cells are produced, and the absorbed antibodies are broken down over time and are not replaced.

The data support a link: only 1 of the 12 calves fed at 1 hour developed an infection, compared with 7 of 12 fed at 24 hours, and the early-fed calves had the most antibodies. However, one early-fed calf still became infected, so early feeding reduces the risk rather than preventing infection, and the groups were small.

Explanation

Antibodies from colostrum (or across the placenta) give passive immunity: protection is immediate but short-lived, because no memory cells are made and the antibodies are gradually broken down. Percentage decrease is the change divided by the starting value (32). To evaluate 'prevents', look for any calf that was still infected and for the size of the groups. Antibodies only protect against antigens they are complementary to, so the mother's previous infections matter.

Mark scheme
  1. 1 mark

    Correct method: (32 - 6) ÷ 32 × 100; or a correct final answer of 81 with no working

    Max 6. Points 1 and 2 are the calculation: a correct answer of 81 (%) with no working scores 2 marks. Accept for 1 mark: 81.25 or 81.3 (not 2 significant figures) OR 0.81 (not multiplied by 100) OR 430 / 433 (the difference divided by 6).

  2. 1 mark

    81 (%)

  3. 1 mark

    This is passive immunity: the antibodies were not made by the calf

    Points 3 to 5: max 2.

  4. 1 mark

    The calf's B cells are not activated / there is no clonal selection, so no memory cells are made

    Reject 'memory cells die'.

  5. 1 mark

    The antibodies are broken down / hydrolysed over time and are not replaced

  6. 1 mark

    (Supports) the fewest calves developed an infection when fed at 1 hour (1 of 12, compared with 7 of 12 at 24 hours) and they had the most antibodies (32 g dm⁻³)

    Points 6 to 11: max 2, with at most 1 mark from point 6 (for the conclusion) and at most 1 mark from points 7 to 11 (against it).

  7. 1 mark

    (Against) one calf fed at 1 hour still developed an infection, so early feeding reduces the risk but does not prevent infection

  8. 1 mark

    (Against) the groups were small (12 calves) / only one trial

  9. 1 mark

    (Against) the colostrum may not contain antibodies against every pathogen that causes gut infections / protection depends on which pathogens the mother has met

  10. 1 mark

    (Against) other factors that affect infection may differ between the groups, e.g. hygiene, the calves' health or birth mass, the antibody content of the colostrum / the calves were not allocated to the groups at random

    Accept 'correlation does not show causation' only if it is linked to other factors.

  11. 1 mark

    (Against) no statistical test was used, so the difference in the number of infections may be due to chance

    Reject 'the results are due to chance'.
Question 2

7 marks

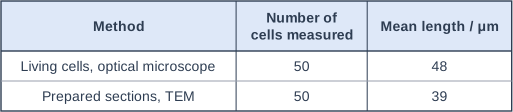
Scientists investigated whether preparing cells for a transmission electron microscope (TEM) changes their size. Tetrahymena is a single-celled organism with no cell wall. The scientists measured the lengths of 50 living Tetrahymena cells with an optical microscope. They prepared other cells from the same culture for the TEM: they fixed the cells with a chemical, removed the water using ethanol, embedded the cells in resin and cut very thin sections. They then measured the lengths of 50 cells in electron micrographs of these sections.

The table shows their results. A statistical test showed that the difference between the mean lengths was significant (P < 0.001).

In one electron micrograph, the image of a Tetrahymena cell had a length of 86 mm. The magnification of the micrograph was × 2000. Calculate the actual length of this cell in μm.

Explain why specimens for a TEM must have the water removed and must be cut into very thin sections.

The scientists concluded that preparing Tetrahymena cells for the TEM makes the cells shrink. Evaluate this conclusion.

Table with columns "Method", "Number of cells measured", "Mean length / μm". Method: Living cells, optical microscope; Number of cells measured: 50; Mean length / μm: 48 | Method: Prepared sections, TEM; Number of cells measured: 50; Mean length / μm: 39.

Model answer

Image length = 86 mm = 86 000 μm
Actual length = image size ÷ magnification = 86 000 ÷ 2000 = 43 μm

The inside of a TEM is a vacuum, so that electrons are not scattered by air molecules; any water in the specimen would evaporate in the vacuum, so it must be removed. The image is formed by electrons passing through the specimen, so it must be very thin.

The difference in mean length (48 μm compared with 39 μm) is significant, so it is unlikely to be due to chance, and removing water could make the cells shrink. However, a thin section often does not pass through the middle of a cell, so the length in a section can be smaller than the real length even if the cell has not shrunk. Also, different cells were measured with each microscope, so the conclusion is not fully supported.

Explanation

Magnification = image size ÷ actual size, so actual size = image size ÷ magnification, with both lengths in the same unit (1 mm = 1000 μm). A TEM needs a vacuum and very thin, dead, dehydrated specimens, which can produce artefacts such as shrinkage. A good evaluation spots that a section cuts each cell at a random level, so lengths measured in sections underestimate real lengths: a systematic error that could explain some or all of the difference. Remember that a significant difference does not show what caused it.

Mark scheme
  1. 1 mark

    Correct method: 86 000 ÷ 2000 (image length converted to μm, divided by the magnification); or a correct final answer of 43 (μm) with no working

    Max 6 if the evaluation gives only points for the conclusion or only points against it. Max 7. Points 1 and 2 are the calculation: a correct answer of 43 μm with no working scores 2 marks. Accept for 1 mark: 0.043 or 4.3 × 10⁻² (the answer in mm, not converted to μm) OR evidence of 86 000 μm (the image length in μm). Do not award either mark for 23 (2000 ÷ 86, the formula inverted).

  2. 1 mark

    43 (μm)

  3. 1 mark

    The inside of a TEM is a vacuum (so electrons are not scattered by air), and water would evaporate / boil in the vacuum, so the specimen must be dehydrated

    Points 3 and 4: 1 mark each. Point 3 needs the idea of a vacuum.

  4. 1 mark

    Electrons must pass through the specimen (to form the image), so the specimen must be very thin

    Accept 'electrons cannot penetrate thick specimens'.

  5. 1 mark

    (Supports) the difference in means is significant / unlikely to be due to chance (P < 0.001)

    Points 5 to 10: max 3.

  6. 1 mark

    (Supports) removing the water / dehydration could reduce the volume of the cells

  7. 1 mark

    (Against) a thin section may not pass through the longest part / middle of a cell, so lengths measured in sections are often smaller than the true length

  8. 1 mark

    (Against) different cells were measured by each method, not the same cells before and after preparation

  9. 1 mark

    (Against) the two microscopes have different resolution / were calibrated separately, so there may be a systematic error in one method (e.g. blurred cell edges in the optical microscope)

  10. 1 mark

    (Against) living cells move / change shape, so their lengths may be measured less precisely

Question 3

8 marks

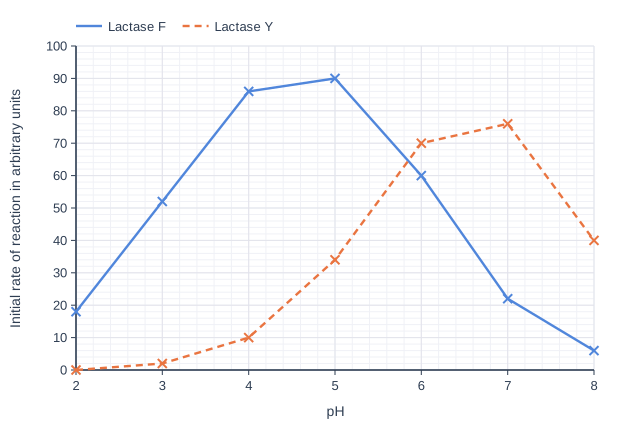
Lactase tablets can be swallowed with milk by people who do not produce lactase. Scientists compared two lactase preparations used in these tablets: lactase F, from a fungus, and lactase Y, from a yeast. They measured the initial rate of hydrolysis of lactose by each enzyme at different pH values, at 37 °C. In every test they used the same concentration of lactose and the same mass of enzyme protein. The graph shows their results.

Calculate the percentage decrease in the rate of reaction of lactase Y when the pH is lowered from 7 to 4. Give your answer to 3 significant figures.

Explain why lactase Y has a very low rate of reaction at pH 3.

After a meal containing milk, the stomach contents stay at about pH 4 for an hour or more. The contents of the small intestine are at about pH 6 to 7. A company claims that tablets containing lactase F are better than tablets containing lactase Y for people who do not produce lactase. Use the graph and your own knowledge to evaluate this claim.

Line graph of initial rate of reaction in arbitrary units (y-axis, 0 to 100) against pH (x-axis, 2 to 8). "Lactase F" joins the points (2, 18), (3, 52), (4, 86), (5, 90), (6, 60), (7, 22), (8, 6). "Lactase Y" (dashed) joins the points (2, 0), (3, 2), (4, 10), (5, 34), (6, 70), (7, 76), (8, 40).

Model answer

Percentage decrease = (76 - 10) ÷ 76 × 100 = 66 ÷ 76 × 100 = 86.8%

At pH 3 there is a high concentration of H⁺ ions. These change the charges on the R groups of amino acids in lactase Y, so ionic and hydrogen bonds holding the tertiary structure break. The shape of the active site changes, so lactose is no longer complementary to it and very few enzyme-substrate complexes form.

For the claim: at pH 4, the pH in the stomach after a milky meal, lactase F hydrolyses lactose about 9 times faster than lactase Y (86 compared with 10), so much more lactose would be hydrolysed in the stomach. Lactase F is still quite active at pH 6 (60).

Against the claim: in the small intestine (pH 6 to 7) lactase Y is faster (70 and 76 compared with 60 and 22). Both enzymes are proteins and may be hydrolysed by proteases in the stomach. The data come from test tubes at constant pH, not from people, so the tablets need to be tested in a trial.

Explanation

Each enzyme has an optimum pH; away from it, H⁺ or OH⁻ ions alter the charges on R groups, breaking ionic and hydrogen bonds so the active site changes shape. An evaluation needs points both for and against the claim, each backed by values from the graph, and a recognition that test-tube results do not show what happens in the gut. Percentage change is always calculated from the starting value (76 at pH 7); dividing by the final value is a common error. Answers such as 'there were no repeats' gain nothing unless linked to the data.

Mark scheme
  1. 1 mark

    Correct method: (76 - 10) ÷ 76 × 100; or a correct final answer of 86.8 with no working

    Max 7 if the evaluation gives only points for the claim or only points against it. Max 8. Points 1 and 2 are the calculation: a correct answer of 86.8 (%) with no working scores 2 marks. Accept for 1 mark: 86.84 or 87 (not given to 3 significant figures) OR 0.868 (not multiplied by 100) OR 13.2 (10 ÷ 76 × 100, the percentage remaining). Do not award either mark for 660 (the difference divided by 10).

  2. 1 mark

    86.8 (%)

    Do not award this mark for 87 or 86.84 (not 3 significant figures), but award point 1.

  3. 1 mark

    (At low pH / high H⁺ concentration) the charges on the R groups / amino acids (in the active site) change

    Points 3 to 6: max 2. Accept 'H⁺ ions interact with / neutralise charged R groups'.

  4. 1 mark

    Ionic bonds / hydrogen bonds (that hold the tertiary structure) are broken

    Reject 'peptide bonds are broken'.

  5. 1 mark

    The tertiary structure / shape of the active site changes / the enzyme is denatured

    Do not accept 'the enzyme is killed'.

  6. 1 mark

    Lactose is no longer complementary to / no longer fits the active site, so few / no enzyme-substrate complexes form

    Accept 'E-S complexes'.

  7. 1 mark

    (For) at pH 4 / in the stomach, lactase F is much faster than lactase Y (86 compared with 10 / about 9 times faster), so more lactose is hydrolysed in the stomach

    Points 7 to 13: max 4. Ignore 'no repeats' or 'no statistical test' with no further explanation.

  8. 1 mark

    (For) lactase F is still fairly active at pH 6 (60, about 86% of the rate of lactase Y), so it also works in the small intestine

  9. 1 mark

    (Against) at pH 6 to 7 / in the small intestine, lactase Y is faster than lactase F (70 and 76 compared with 60 and 22)

    Accept a correct comparison at pH 7 alone.

  10. 1 mark

    (Against) the enzymes are proteins and may be hydrolysed by protease(s) in the stomach

    Accept 'digested by pepsin / endopeptidases'.

  11. 1 mark

    (Against) the stomach pH may fall lower (towards pH 2), where lactase F is much less active (18)

  12. 1 mark

    (Against) the results are from a test tube at a constant pH, so they may not apply in the body / the tablets were not tested on people

  13. 1 mark

    (Against) only the initial rate was measured, so it is not known how long each enzyme stays active (at that pH)

Question 4

8 marks

Glucose produced by hydrolysing the cellulose in wheat straw can be fermented to make ethanol for fuel. In plant cell walls, cellulose molecules form microfibrils, which are surrounded by other polymers, including lignin.

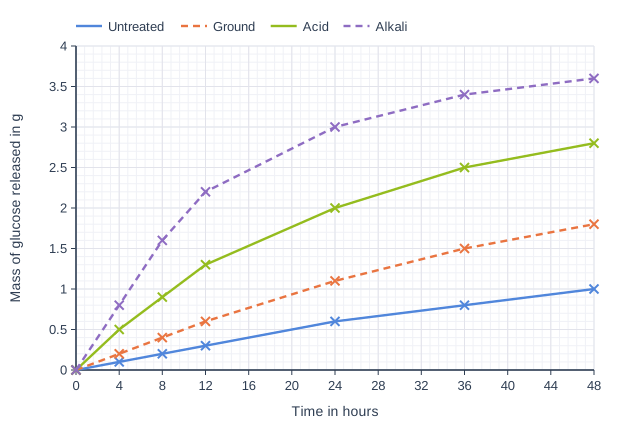
Scientists investigated four ways of treating 10 g samples of straw before adding the enzyme cellulase: chopped only (untreated), ground into a fine powder, heated with dilute acid, and heated with dilute alkali, which removes most of the lignin. They incubated each sample with the same concentration of cellulase at 50 °C and measured the mass of glucose released over 48 hours. The graph shows their results.

Each 10 g sample of straw contained 4.0 g of cellulose. Complete hydrolysis of this cellulose would produce 4.4 g of glucose. Calculate the percentage of the cellulose that was hydrolysed in 48 hours in the alkali-treated straw. Give your answer to 3 significant figures.

Describe a control that the scientists should have included for each treatment, and explain why it is needed.

Suggest explanations for the effects of grinding and of alkali treatment on the release of glucose.

A biofuel company wants to choose one of these treatments. Evaluate the use of alkali treatment.

Line graph of mass of glucose released in g (y-axis, 0 to 4) against time in hours (x-axis, 0 to 48). "Untreated" joins the points (0, 0), (4, 0.1), (8, 0.2), (12, 0.3), (24, 0.6), (36, 0.8), (48, 1). "Ground" (dashed) joins the points (0, 0), (4, 0.2), (8, 0.4), (12, 0.6), (24, 1.1), (36, 1.5), (48, 1.8). "Acid" joins the points (0, 0), (4, 0.5), (8, 0.9), (12, 1.3), (24, 2), (36, 2.5), (48, 2.8). "Alkali" (dashed) joins the points (0, 0), (4, 0.8), (8, 1.6), (12, 2.2), (24, 3), (36, 3.4), (48, 3.6).

Model answer

Mass of glucose at 48 hours (alkali) = 3.6 g
Percentage hydrolysed = 3.6 ÷ 4.4 × 100 = 81.8%

For each treatment, the scientists should have incubated treated straw in the same way but with boiled (denatured) cellulase, or water, instead of cellulase. This would show that the glucose was released by cellulase and not by the treatment itself: heating with acid, for example, can hydrolyse some glycosidic bonds.

Grinding increases the surface area of the straw, so more cellulose is exposed and more enzyme-substrate complexes form per minute. Lignin surrounds the cellulose microfibrils, so removing it with alkali lets cellulase reach and bind to much more of the cellulose.

Alkali treatment released the most glucose (3.6 g, 82% of the maximum) and released it fastest (1.6 g in the first 8 hours, compared with 0.2 g for untreated straw). However, heating with alkali costs energy and chemicals, and the alkali would have to be neutralised before the enzyme and yeast were added. Only one temperature and one cellulase concentration were tested, so the company would need further trials.

Explanation

Cellulose is a polymer of β-glucose joined by glycosidic bonds; its chains are held in microfibrils by hydrogen bonds and, in cell walls, are surrounded by lignin. Enzymes can only act on substrate they can reach, so increasing the surface area or removing lignin increases the rate; a control without active enzyme is needed because a harsh treatment such as hot acid may release some glucose by itself. The percentage hydrolysed uses the maximum possible glucose (4.4 g), not the mass of cellulose. A good evaluation weighs the extra glucose against cost and practical problems.

Mark scheme
  1. 1 mark

    Correct method: 3.6 ÷ 4.4 × 100; or a correct final answer of 81.8 with no working

    Max 8. Points 1 and 2 are the calculation: a correct answer of 81.8 (%) with no working scores 2 marks. The mass of glucose at 48 hours (3.6 g) is read from the graph. Accept for 1 mark: 82 or 81.82 (not 3 significant figures) OR 0.818 (not multiplied by 100) OR 90 (3.6 ÷ 4.0, divided by the mass of cellulose) OR 36 (3.6 ÷ 10).

  2. 1 mark

    81.8 (%)

  3. 1 mark

    Straw given each treatment (e.g. heated with acid or with alkali) and incubated in the same way but without cellulase / with boiled (denatured) cellulase

    Points 3 and 4: 1 mark each. Accept 'treated straw with water or buffer instead of cellulase'. Insufficient: 'a sample with no treatment' (the untreated straw is already included) or 'a control' with no description.

  4. 1 mark

    To show that the glucose was released by cellulase / by the enzyme, and not by the treatment itself (e.g. hot acid may hydrolyse some glycosidic bonds) or from free glucose already in the straw

    Accept 'to show that the acid or alkali does not release glucose on its own'. Insufficient: 'to make it a fair test' or 'to compare with' with no reason. Reject 'as a control variable'.

  5. 1 mark

    Grinding increases the surface area (of the straw), so more cellulose is exposed to cellulase / more enzyme-substrate complexes form

    Points 5 to 7: max 2.

  6. 1 mark

    Lignin surrounds / covers the cellulose (microfibrils), so removing it lets cellulase reach / bind to more of the cellulose

  7. 1 mark

    Alkali may also separate / loosen the cellulose microfibrils (by breaking hydrogen bonds between chains), exposing more cellulose chains

  8. 1 mark

    (For) alkali treatment gives the most glucose and the fastest release (3.6 g, 82%, in 48 hours; 1.6 g in the first 8 hours compared with 0.2 g for untreated straw)

    Points 8 to 13: max 2, with at most 1 mark from point 8 (for alkali treatment) and at most 1 mark from points 9 to 13 (against it).

  9. 1 mark

    (Against) heating and the alkali cost money / energy, which may outweigh the extra glucose

  10. 1 mark

    (Against) the alkali must be removed / neutralised before the cellulase or the fermenting yeast is added

  11. 1 mark

    (Against) the alkali produces waste that must be disposed of

  12. 1 mark

    (Against) only one set of conditions was tested (one temperature / one concentration of cellulase / one type of straw)

  13. 1 mark

    (Against) no repeats / variation / statistical test are shown

Ready to try the rest? Every answer you write is marked against the mark scheme, so you can see exactly where the marks are.

Study Helper Hints first, answers after you try

Stuck on this one? Ask for a hint and I’ll point you in the right direction, without giving the answer away. Once you’ve checked your answer, I’ll show you how the marks are awarded.