Level:
Correct: 0
Incorrect: 0
Marks: 0/0
Exam Practice
Course:
Topics:
AQA A-Level Biology (Paper 3) Smart practice A mixed round aimed at your weak spots
Unit 1
Required practical activities
Unit 2
Practical and mathematical skills
Unit 3
Critical analysis of experimental data
Unit 4
The essay
Avg
score:
–
Topics
done:
0/26

Data analysis: genetics, variation and evolution

Practise 14 exam-style questions on Data analysis: genetics, variation and evolution for AQA A-Level Biology (Paper 3). Write your answer as you would in the exam and get it marked in seconds against the mark scheme, point by point, with the Study Helper on hand if you get stuck.

  • 14 questions
  • 5–9 marks each
  • Instant marking
  • No sign-up needed
14 questions, marked as you go

Sample questions with model answers

Here are 4 of the questions in this topic, each with a model answer, an explanation of why it earns the marks and the mark scheme an examiner would use.

Question 1

5 marks

Scientists studied a population of a small songbird that breeds in nest boxes in a wood. Over 6 years, they recorded the number of eggs laid in each nest (the clutch size). They ringed the young birds before they left the nest and recorded how many of them survived to breed the following year. The table shows their results.

Explain how these data show that stabilising selection acts on clutch size in this population.

Suggest one reason why nests with large clutches produced fewer young that survived to breed.

Suggest why the scientists collected data over 6 years rather than over 1 year.
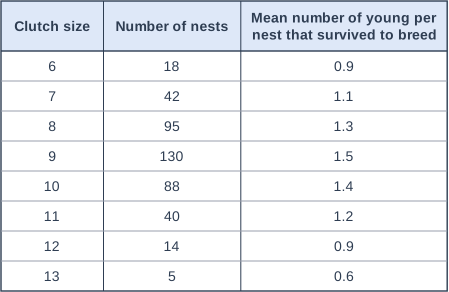
Table with columns "Clutch size", "Number of nests", "Mean number of young per nest that survived to breed". Clutch size: 6; Number of nests: 18; Mean number of young per nest that survived to breed: 0.9 | Clutch size: 7; Number of nests: 42; Mean number of young per nest that survived to breed: 1.1 | Clutch size: 8; Number of nests: 95; Mean number of young per nest that survived to breed: 1.3 | Clutch size: 9; Number of nests: 130; Mean number of young per nest that survived to breed: 1.5 | Clutch size: 10; Number of nests: 88; Mean number of young per nest that survived to breed: 1.4 | Clutch size: 11; Number of nests: 40; Mean number of young per nest that survived to breed: 1.2 | Clutch size: 12; Number of nests: 14; Mean number of young per nest that survived to breed: 0.9 | Clutch size: 13; Number of nests: 5; Mean number of young per nest that survived to breed: 0.6.

Model answer

The most common clutch size, 9 eggs, produced the most young that survived to breed (1.5 per nest). Smaller and larger clutches produced fewer, for example 0.9 per nest from clutches of 6 and 0.6 from clutches of 13. So birds that lay an intermediate number of eggs pass on more of their alleles, and alleles for very small or very large clutches are passed on less. Selection acts against both extremes, so the mean clutch size stays at about 9 and the variation is kept narrow.

In large clutches the parents cannot collect enough food for every chick, so each chick is lighter and less likely to survive.

Conditions such as food supply and weather vary from year to year, so data from 6 years are more representative than data from one, possibly unusual, year.

Explanation

Stabilising selection favours the intermediate phenotype and acts against both extremes, so the mean stays the same and the spread is reduced; human birth weight is the classic example. Here, the clutch size that is most common is also the one that produces the most surviving young. Use figures from both sides of the peak. Note that more eggs do not mean more surviving young: the number of chicks that parents can feed limits survival.

Mark scheme
  1. 1 mark

    The most common clutch size (9) produced the most young that survived to breed (1.5 per nest)

    Max 5. Points 1 to 5: max 3.

  2. 1 mark

    Clutches smaller or larger than 9 produced fewer young that survived to breed, e.g. 0.9 from clutches of 6 and 0.6 from clutches of 13

    Accept any correct pair of values from either side of 9.

  3. 1 mark

    (If clutch size is affected by genes,) alleles for intermediate clutch sizes are passed on more than alleles for very small or very large clutches

    Accept 'birds that lay extreme clutch sizes pass on fewer of their alleles'.

  4. 1 mark

    So selection acts against both extremes and the mean / most common clutch size stays the same (at about 9)

  5. 1 mark

    And the variation / range of clutch sizes is reduced (or stays narrow) over generations

  6. 1 mark

    Parents cannot collect enough food for all the chicks, so each chick gets less food / is lighter / is less likely to survive

    Points 6 to 8: max 1. List rule: if more than one reason is given, a wrong or contradictory extra answer cancels the correct one.

  7. 1 mark

    More chicks in a nest means more competition between the chicks (so the smaller chicks get little food)

  8. 1 mark

    A large brood is more at risk from natural enemies (e.g. noisy nests attract predators, or parasites spread between chicks)

  9. 1 mark

    Conditions (e.g. food supply, weather) vary between years, so data from several years are more representative / reduce the effect of one unusual year

    Points 9 and 10: max 1.

  10. 1 mark

    To get a larger sample of nests, so the results are more reliable / representative

    Accept 'to reduce the effect of anomalies' or 'very small and very large clutches are rare, so more years are needed to get enough data for them'.
Question 2

7 marks

The antibiotic rifampicin binds to bacterial RNA polymerase and stops transcription. Bacteria can become resistant to rifampicin by a mutation in the gene for RNA polymerase that changes the shape of the site where rifampicin binds.

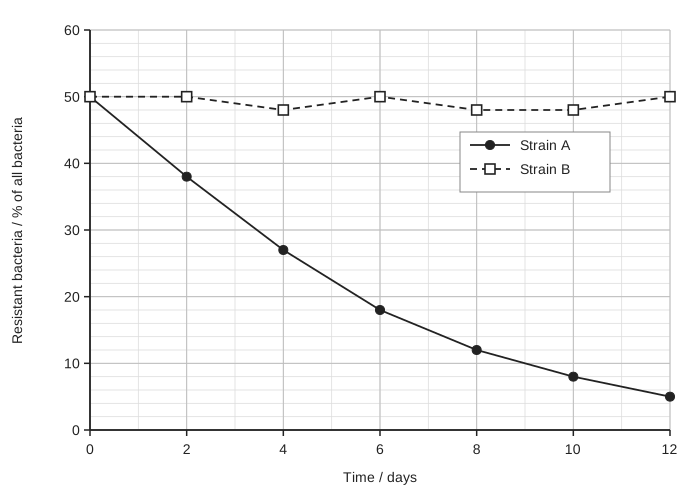
Scientists investigated two resistant strains, A and B, of one species of bacterium. Each strain has a different mutation in the gene for RNA polymerase. For each strain, they mixed equal numbers of resistant bacteria and non-resistant bacteria in a flask of nutrient broth containing no rifampicin. Every 2 days, they transferred a sample into fresh broth and found the percentage of the bacteria that were resistant. The graph shows their results.

On day 8, the flask containing strain A had 2.0 × 10⁹ bacteria per cm³. Calculate the number of resistant bacteria per cm³ in this flask on day 8. Give your answer in standard form.

Suggest and explain why the percentage of resistant bacteria in the flask containing strain A decreased, even though there was no rifampicin.

A doctor suggested that if hospitals stopped using rifampicin, bacteria resistant to it would disappear. Use the data to evaluate this suggestion.

Line graph of resistant bacteria as a percentage of all bacteria (vertical axis, 0 to 60, with gridlines every 2%) against time in days (horizontal axis, 0 to 12). Strain A (solid line, filled circles) starts at 50% on day 0 and falls in a curve, more steeply at first, to 5% on day 12. Strain B (dashed line, open squares) stays at about 48 to 50% throughout. Points are plotted every 2 days.

Model answer

On day 8, 12% of the strain A bacteria were resistant.
Number of resistant bacteria = 12 ÷ 100 × 2.0 × 10⁹ = 2.4 × 10⁸ per cm³

The mutation changes the amino acid sequence of RNA polymerase, and so its tertiary structure and the shape of its active site. The enzyme therefore works less efficiently, so transcription, protein synthesis and cell division are slower in the resistant bacteria. Without rifampicin, the non-resistant bacteria grow faster and out-compete them, so the resistant bacteria make up a smaller percentage after every transfer.

The data partly support the suggestion: without rifampicin, resistant strain A fell from 50% to 5% of the bacteria in 12 days. However, strain A had not disappeared, and the percentage of resistant strain B bacteria did not fall at all, so resistance with no cost would remain. The investigation was also done in broth in a laboratory, not in hospitals.

Explanation

Resistance often has a "fitness cost": the changed enzyme that no longer binds the antibiotic also works less well, so resistant bacteria grow more slowly when the antibiotic is absent. Directional selection then works in reverse, reducing their frequency. Strain B shows that not every resistance mutation has a cost, so stopping an antibiotic does not guarantee that resistance disappears. In the calculation, read 12% from the graph and convert it to a decimal (0.12) before multiplying; give the answer in standard form as asked.

Mark scheme
  1. 1 mark

    Correct method: 12 ÷ 100 × 2.0 × 10⁹ (12% read from the graph); or a correct final answer of 2.4 × 10⁸ with no working

    Max 7. Points 1 and 2: a correct answer of 2.4 × 10⁸ with no working scores 2 marks. Accept for 1 mark: 240 000 000 (not in standard form), OR 2.4 × 10¹⁰ (12 × 2.0 × 10⁹, not divided by 100), OR a correct calculation from a misread percentage between 11 and 13 (e.g. 2.2 × 10⁸ or 2.6 × 10⁸).

  2. 1 mark

    2.4 × 10⁸ (bacteria per cm³)

  3. 1 mark

    The mutation changes the amino acid sequence (primary structure) and so the tertiary structure / shape of RNA polymerase (or its active site)

    Points 3 to 6: max 2, with at most 1 mark from points 3 and 4 (the effect of the mutation on the enzyme).

  4. 1 mark

    So the RNA polymerase of strain A works less efficiently / transcription is slower

    Accept 'less mRNA is made'.

  5. 1 mark

    So protein synthesis / growth / cell division (binary fission) of resistant bacteria is slower

    Reject mitosis for bacterial division.

  6. 1 mark

    So non-resistant bacteria out-compete the resistant bacteria (for nutrients) and make up an increasing proportion after each transfer

    Accept 'resistant bacteria have lower fitness without the antibiotic'.

  7. 1 mark

    Supports: without rifampicin, the percentage of resistant strain A bacteria fell from 50% to 5% in 12 days

    Points 7 to 12: max 3; an answer that gives only points supporting the suggestion, or only points against it, scores at most 2 of these marks.

  8. 1 mark

    Against: strain A had not disappeared after 12 days (5% were still resistant / about 10⁸ bacteria per cm³)

  9. 1 mark

    Against: the percentage of resistant strain B bacteria did not decrease (stayed at about 50%), so resistance that has no cost would persist

  10. 1 mark

    Against: the investigation was in broth in a laboratory, with one species, so may not apply to bacteria in hospitals / in the body

  11. 1 mark

    Against: further mutations could restore the fitness of resistant bacteria

  12. 1 mark

    Against: other antibiotics (or other substances) might also select for these bacteria / genes for resistance may be linked to other resistance genes

Question 3

8 marks

Scientists investigated the evolution of reproductive isolation in a group of toads that live in separate river valleys. Toads cannot move between the valleys.

The scientists chose 14 pairs of populations. For each pair, they:
- calculated the genetic distance between the two populations, as the percentage of bases that differ in the same 1200-base section of a gene coding for an enzyme used in respiration
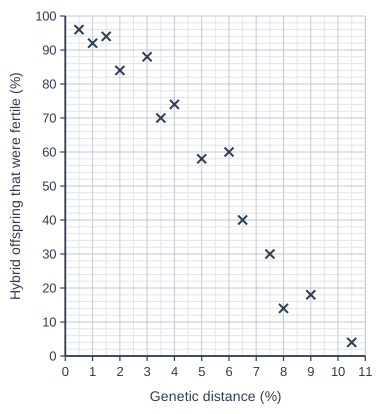
- crossed toads from the two populations and found the percentage of the hybrid offspring that were fertile as adults.

The graph shows their results.

Describe the relationship shown in the graph.

The scientists calculated Spearman's rank correlation coefficient (rs) for their data as -0.98. The critical value of rs for 14 pairs of data at P = 0.05 is 0.538. What can you conclude from this result?

Explain how two populations in separate valleys could become two different species.

The scientists suggested that the differences in the base sequence of the gene they studied cause the hybrids to be infertile. Evaluate this suggestion.

Scatter graph on a grid of small squares. The horizontal axis is "Genetic distance (%)", from 0 to 11, numbered every 1, with 2 small squares between numbered values (each small square is 0.5). The vertical axis is "Hybrid offspring that were fertile (%)", from 0 to 100, numbered every 10, with 5 small squares between numbered values (each small square is 2). 14 points are plotted as crosses: (0.5, 96), (1, 92), (1.5, 94), (2, 84), (3, 88), (3.5, 70), (4, 74), (5, 58), (6, 60), (6.5, 40), (7.5, 30), (8, 14), (9, 18) and (10.5, 4).

Model answer

There is a negative correlation: as the genetic distance between two populations increases, the percentage of hybrid offspring that are fertile decreases, from over 90% at distances below 2% to below 20% at distances above 8%.

The value of rs (0.98, ignoring the sign) is greater than the critical value of 0.538, so the negative correlation is significant. The probability that it is due to chance is less than 5%, so the null hypothesis of no correlation is rejected.

Toads cannot move between the valleys, so there is no gene flow between the populations. Different mutations arise in each population, and the valleys have different environments, so natural selection favours different alleles in each. Genetic drift also changes allele frequencies by chance. The gene pools become more and more different until toads from the two populations can no longer interbreed to produce fertile offspring: they have become reproductively isolated and are different species.

Correlation does not prove causation. The gene studied codes for a respiratory enzyme, so it is unlikely to affect fertility directly. Genetic distance is more likely to be a measure of how long the populations have been separated; during that time differences in other genes, such as those affecting meiosis, also accumulated and cause the infertility. Only one gene was studied.

Explanation

This is allopatric speciation: isolation stops gene flow, and mutation, different selection pressures and genetic drift then change the gene pools independently until the populations cannot produce fertile offspring together. In a correlation test, compare the size of rs (ignoring its sign) with the critical value; a value at or above it means the correlation is significant and the null hypothesis is rejected. A significant correlation never proves that one variable causes the other; here the gene is a "clock" for time since separation, not a cause of infertility.

Mark scheme
  1. 1 mark

    Negative correlation: as genetic distance increases, the percentage of (hybrid) offspring that are fertile decreases

    Max 8. Point 1: accept 'inverse relationship' or a correct description with values, e.g. over 90% fertile at distances below 2% and below 20% at distances above 8%. Insufficient: 'they are related' or 'there is a correlation' with no direction.

  2. 1 mark

    The value of rs (0.98, ignoring the sign) is greater than the critical value (0.538), so the (negative) correlation is significant

    Points 2 and 3. Reject 'this proves that genetic distance causes infertility'.

  3. 1 mark

    So the probability that the correlation is due to chance is less than 5% (0.05) / the null hypothesis (of no correlation) is rejected

    Reject 'the results are not due to chance'. Do not accept 'the null hypothesis is accepted'.

  4. 1 mark

    (Geographical isolation means) there is no gene flow / interbreeding between the populations

    Points 4 to 8: max 2. Reject sympatric speciation.

  5. 1 mark

    Different mutations arise in each population

  6. 1 mark

    The valleys have different environments / selection pressures, so different alleles are selected (natural selection)

    Accept 'different alleles give an advantage in each valley'.

  7. 1 mark

    Genetic drift (in small populations) changes allele frequencies by chance

  8. 1 mark

    Allele frequencies / gene pools become (increasingly) different, until members of the two populations can no longer interbreed to produce fertile offspring (reproductive isolation)

    Accept 'they become reproductively isolated'. Insufficient: 'they cannot breed' with no reference to fertile offspring or reproductive isolation.

  9. 1 mark

    Correlation does not prove causation / another factor could cause both

    Points 9 to 12: max 3.

  10. 1 mark

    The gene codes for a respiratory enzyme, so its base sequence is unlikely to affect fertility (directly)

  11. 1 mark

    Genetic distance reflects the time since the populations separated, during which differences in other genes (that do affect fertility, e.g. meiosis or gamete formation) also accumulated

    Accept 'the gene is a marker of how long the populations have been separated'.

  12. 1 mark

    Only one gene / 1200 bases was studied, so it may not represent differences in the whole genome

Question 4

9 marks

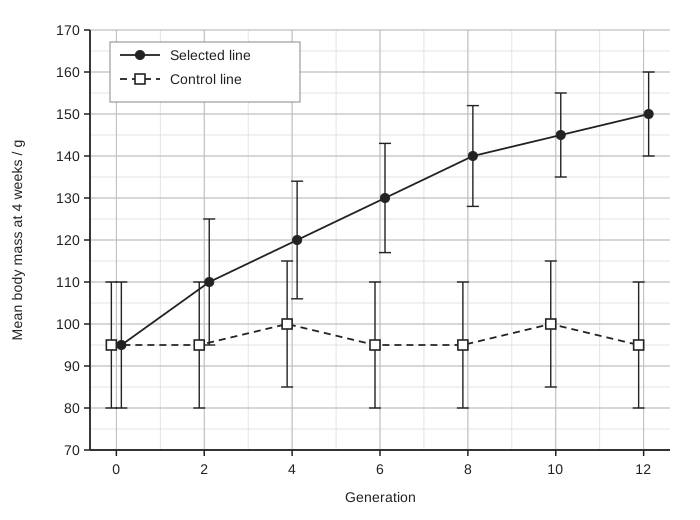
Scientists investigated artificial selection for body mass in Japanese quail, a small bird. They divided one large flock into two lines.
- Selected line: in each generation, only the 20 heaviest males and the 20 heaviest females at 4 weeks old were used for breeding.
- Control line: in each generation, 20 males and 20 females chosen at random were used for breeding.

In each generation, about 150 young birds in each line were reared in the same conditions, and every bird was weighed at 4 weeks old. The graph shows the mean body mass at 4 weeks in each line. The error bars show ± 2 standard deviations from the mean, which includes over 95% of the data.

Calculate the percentage increase in mean body mass in the selected line between generation 0 and generation 12. Give your answer to 3 significant figures.

Explain why the scientists kept a control line.

Use the error bars to describe how the difference between the two lines changed between generation 0 and generation 12.

The increase in mean body mass in the selected line slowed down in later generations. Use the graph and your knowledge of genetic diversity to suggest an explanation.

Suggest how the scientists could find out whether the selected line now has a lower genetic diversity than the control line.

Line graph of mean body mass at 4 weeks in grams (vertical axis, 70 to 170, gridlines every 5 g) against generation (horizontal axis, 0 to 12). Two lines with error bars at generations 0, 2, 4, 6, 8, 10 and 12: the selected line (solid line, filled circles) rises from 95 g to 150 g, rising more slowly in later generations; the control line (dashed line, open squares) stays between 95 g and 100 g. The error bars show plus and minus 2 standard deviations: about plus and minus 15 g for the control line throughout, and for the selected line getting shorter from plus and minus 15 g to plus and minus 10 g.

Model answer

Percentage increase = (150 - 95) ÷ 95 × 100 = 55 ÷ 95 × 100 = 57.9%

The control line shows what happens to body mass without selection. Its mean stayed at about 95-100 g, so the increase in the selected line was caused by selecting the heaviest birds, not by changes in food or conditions between generations.

At generations 0, 2 and 4 the error bars of the two lines overlap, so the difference between the means is probably due to chance. From generation 6 to generation 12 the error bars do not overlap, so the difference is probably not due to chance, and it becomes larger.

Selecting only the heaviest birds removes alleles for low body mass, so alleles for high body mass become fixed and the birds become homozygous for them. There is then less genetic variation for selection to act on. The error bars of the selected line got smaller (from ± 15 g to ± 10 g), which shows the variation decreasing. Only 40 birds were bred each generation, so alleles were also lost by genetic drift.

The scientists could take random samples of birds from each line, find the base sequences of several genes and count the number of different alleles of each gene. Fewer alleles in the selected line would show lower genetic diversity.

Explanation

Artificial selection works like directional selection: only individuals at one extreme breed, so alleles for that extreme increase in frequency. The response slows because the genetic variation is used up: alleles are lost, others become fixed, and the spread of phenotypes (the error bars) narrows. Overlapping ± 2 SD bars suggest a difference may be due to chance; non-overlapping bars suggest it is probably real. Always say it is the difference that may be due to chance, never "the results".

Mark scheme
  1. 1 mark

    Correct method: (150 - 95) ÷ 95 × 100; or a correct final answer of 57.9 (%) with no working

    Max 9. Points 1 and 2: a correct answer of 57.9% with no working scores 2 marks. Accept for 1 mark: 0.579 (not multiplied by 100), OR 158 / 157.9 (150 ÷ 95 × 100, with 100 not subtracted), OR 36.7 (increase divided by 150), OR 58 / 57.89 (not given to 3 significant figures).

  2. 1 mark

    57.9 (%)

    Do not accept 58 for this mark.

  3. 1 mark

    To show that the increase in body mass in the selected line is due to the selection (of the heaviest birds), and not to other factors / changes in conditions (e.g. food or temperature) between generations

    Point 3. Accept 'to show that body mass does not change without selection'. Reject 'as a control variable'. Insufficient: 'to compare the results' or 'to make it fair' with no further explanation.

  4. 1 mark

    At generations 0, 2 and 4 (early generations) the error bars / ± 2 SD ranges overlap, so the difference (in means) is probably due to chance / is not significant

    Points 4 and 5. Point 4: accept a correct reference to any one of generations 0, 2 or 4. Reject 'the results are due to chance' and 'the results are not significant' (it is the difference between the means that may be due to chance).

  5. 1 mark

    From generation 6 (to 12) the error bars do not overlap, so the difference is probably not due to chance / is significant (and the gap widens)

    Point 5: accept a correct reference to any of generations 6 to 12. Reject 'the results are significant'.

  6. 1 mark

    Selection reduces genetic diversity: alleles for low body mass are lost / alleles for high body mass become fixed / the birds become homozygous for alleles for high body mass

    Points 6 to 11: max 2. Insufficient: 'genes are lost' (alleles are lost, not genes).

  7. 1 mark

    So there is less genetic variation for selection to act on

    Accept 'fewer different alleles left to select from'.

  8. 1 mark

    Evidence: the error bars / variation of the selected line became smaller (from ± 15 g to ± 10 g) but those of the control line did not

    Accept a correct description of the narrowing error bars without exact values.

  9. 1 mark

    Only 40 birds were bred in each generation (a small population), so alleles may also be lost by genetic drift / inbreeding

  10. 1 mark

    The birds may be approaching a physiological limit to body mass

  11. 1 mark

    The heaviest birds may be less fertile / produce fewer offspring, so selection is less effective

  12. 1 mark

    Take (random) samples of the same number of birds from each line

    Points 12 to 14: max 2. Insufficient: 'do a DNA test' with no further detail.

  13. 1 mark

    Find the base sequences of (the same / several) genes / compare base sequences of DNA (or mRNA) / compare amino acid sequences of proteins

    Accept 'compare the frequency of observable characteristics' for this point.

  14. 1 mark

    Count the number of different alleles (or different base sequences) of each gene; fewer different alleles in the selected line means lower genetic diversity

    Accept 'find the proportion of genes for which birds are heterozygous'.

Ready to try the rest? Every answer you write is marked against the mark scheme, so you can see exactly where the marks are.

Study Helper Hints first, answers after you try

Stuck on this one? Ask for a hint and I’ll point you in the right direction, without giving the answer away. Once you’ve checked your answer, I’ll show you how the marks are awarded.