Level:
Correct: 0
Incorrect: 0
Marks: 0/0
Exam Practice
Course:
Topics:
AQA A-Level Biology (Paper 3) Smart practice A mixed round aimed at your weak spots
Unit 1
Required practical activities
Unit 2
Practical and mathematical skills
Unit 3
Critical analysis of experimental data
Unit 4
The essay
Avg
score:
–
Topics
done:
0/26

Data analysis: gene expression and gene technology

Practise 14 exam-style questions on Data analysis: gene expression and gene technology for AQA A-Level Biology (Paper 3). Write your answer as you would in the exam and get it marked in seconds against the mark scheme, point by point, with the Study Helper on hand if you get stuck.

  • 14 questions
  • 6–9 marks each
  • Instant marking
  • No sign-up needed
14 questions, marked as you go

Sample questions with model answers

Here are 4 of the questions in this topic, each with a model answer, an explanation of why it earns the marks and the mark scheme an examiner would use.

Question 1

7 marks

Gene G codes for an enzyme that breaks down some of the toxic chemicals in tobacco smoke. Scientists investigated whether smoking affects the methylation of the promoter of gene G. They measured the percentage of DNA molecules in which one cytosine in the promoter was methylated, in white blood cells from 600 adults.

The table shows their results. The concentration of mRNA transcribed from gene G was 3.2 times higher in the white blood cells of current smokers than in those of people who had never smoked.

Calculate the percentage decrease in the mean methylation in current smokers compared with people who had never smoked. Give your answer to 3 significant figures.

Explain how the lower methylation could result in the higher concentration of mRNA from gene G in smokers.

What do the data for former smokers suggest about this change in methylation?

A doctor suggested that a blood test for the methylation of gene G could show whether a person is a current smoker. Use the means and standard deviations to evaluate this suggestion. Mean ± 2 standard deviations includes over 95% of the data.
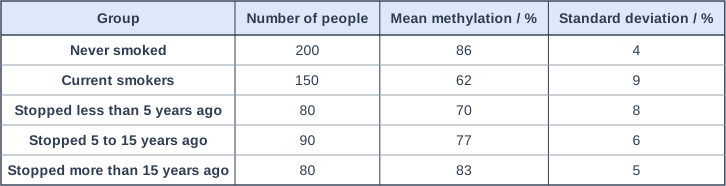
Table with columns "Group", "Number of people", "Mean methylation / %", "Standard deviation / %". Group: Never smoked; Number of people: 200; Mean methylation / %: 86; Standard deviation / %: 4 | Group: Current smokers; Number of people: 150; Mean methylation / %: 62; Standard deviation / %: 9 | Group: Stopped less than 5 years ago; Number of people: 80; Mean methylation / %: 70; Standard deviation / %: 8 | Group: Stopped 5 to 15 years ago; Number of people: 90; Mean methylation / %: 77; Standard deviation / %: 6 | Group: Stopped more than 15 years ago; Number of people: 80; Mean methylation / %: 83; Standard deviation / %: 5.

Model answer

Percentage decrease = (86 - 62) ÷ 86 × 100 = 24 ÷ 86 × 100 = 27.9%

Methyl groups on the promoter of gene G prevent transcription factors and RNA polymerase from binding. With less methylation, more transcription factors and RNA polymerase can bind, so gene G is transcribed more and more mRNA is produced.

Methylation increases with time since stopping smoking (70%, 77%, 83%), so the change is caused by the environment and is reversible, although after more than 15 years it is still slightly below that of people who have never smoked (86%).

Mean ± 2 SD: never smoked 86 ± 8 = 78 to 94%; current smokers 62 ± 18 = 44 to 80%. The means are very different, so a low value suggests smoking, but the ranges overlap between 78 and 80%, so some smokers would give the same result as some non-smokers. Former smokers who stopped recently also have low values (54 to 86% for under 5 years), so a low value would not prove that a person is a current smoker.

Explanation

Methylation of a promoter stops transcription factors and RNA polymerase binding, so it inhibits transcription; less methylation allows more transcription. Epigenetic changes are caused by the environment and do not change the base sequence, so they can be reversed, as the former smokers show. For a test to classify individuals, the ranges (mean ± 2 SD) of the groups must not overlap; a large difference between means is not enough when individuals vary a lot.

Mark scheme
  1. 1 mark

    Correct method: (86 - 62) ÷ 86 × 100; or a correct final answer of 27.9 with no working

    Max 7. A correct answer of 27.9% with no working scores 2 marks (points 1 and 2). Accept for 1 mark: 0.279 (not multiplied by 100) OR 38.7 (difference divided by 62) OR 28 or 27.91 (not given to 3 significant figures).

  2. 1 mark

    27.9 (%)

  3. 1 mark

    Methyl groups (on the promoter) prevent transcription factors / RNA polymerase binding (to the promoter)

    Points 3 and 4: max 2. Accept 'methylation makes the promoter / DNA inaccessible to transcription factors'.

  4. 1 mark

    With less methylation, more transcription factors / RNA polymerase bind, so gene G is transcribed more (more mRNA)

    Reject 'more gene G is made' or 'more DNA is made'. Reject 'translation' instead of transcription.

  5. 1 mark

    Methylation increases with time since stopping smoking (70% to 77% to 83%), so the change is reversible / is caused by the environment (smoking) / returns towards the level in never-smokers, but has not fully returned even after 15 years (83% compared with 86%)

    Either idea scores the mark: reversible / reverses over time, or not fully reversed after 15 years. Accept 'it is an epigenetic change that can be reversed'.

  6. 1 mark

    Correct ranges: never smoked 78 to 94 (%) AND current smokers 44 to 80 (%)

    Points 6 to 8: max 2.

  7. 1 mark

    The ranges overlap (78 to 80), so some smokers would have the same result as some never-smokers / the test could not always tell them apart

    A statement that the means are very different, so most smokers would be identified, does not score on its own: credit it for this point only together with the overlap.

  8. 1 mark

    Former smokers (who stopped less than 15 years ago) also have low methylation / ranges overlap with current smokers / other factors such as age or pollution could affect methylation, so a low value does not prove a person is a current smoker

    One correct reason scores the mark.
Question 2

7 marks

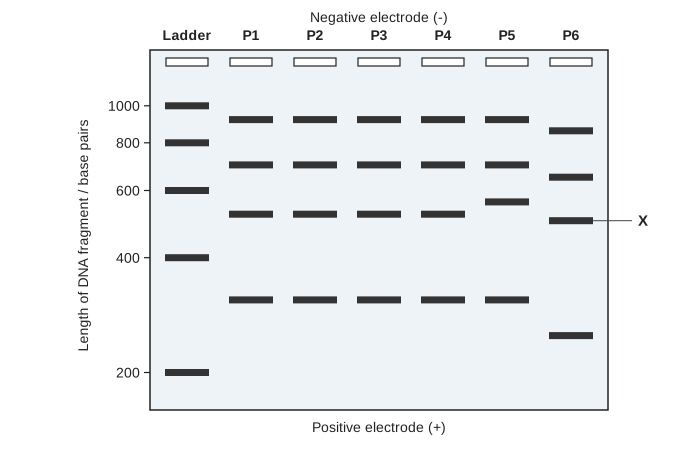
Tuberculosis (TB) is caused by a bacterium. Doctors investigated an outbreak of TB in a city. They took a sample of sputum (mucus coughed up from the lungs) from each of 6 patients, P1 to P6. They amplified several variable number tandem repeat (VNTR) regions of the bacterial DNA by PCR, using primers that bind only to DNA of the TB bacterium, and separated the fragments by gel electrophoresis. The figure shows the results, with a ladder of DNA fragments of known length.

Explain why it was important that the primers bind only to DNA of the TB bacterium.

Explain why the fragments separate during gel electrophoresis.

Use the ladder to estimate the length of fragment X.

What can you conclude from the figure about the spread of TB in this outbreak? Explain your answer.

Suggest one limitation of using these fingerprints to find out who infected whom.

A gel electrophoresis diagram with seven lanes: a ladder and lanes P1 to P6, with the negative electrode at the top (wells) and the positive electrode at the bottom. The ladder has bands labelled 1000, 800, 600, 400 and 200 base pairs from top to bottom, with the bands closer together towards the top. Lanes P1, P2, P3 and P4 each have the same four bands. Lane P5 has the same four bands except that its third band is a little higher than in P1 to P4. Lane P6 has four bands, all at different positions from the other lanes; its third band, labelled X, lies between the 600 and 400 base pair bands of the ladder, a little nearer to 600.

Model answer

The sputum also contains the patient's own DNA. If the primers bound to human DNA, human VNTRs would also be amplified and give extra bands, so the fingerprint would not show only the bacterium's VNTRs.

DNA fragments are negatively charged because of their phosphate groups, so they move towards the positive electrode; shorter fragments move faster through the gel, so they travel further in the same time.

Fragment X is about 500 base pairs long.

P1, P2, P3 and P4 have identical patterns of bands, so they were infected by the same strain and probably caught TB from the same source or from each other. P6 has a completely different pattern, so it was infected by a different strain and is not part of the outbreak. P5 has the same pattern as P1 to P4 except for one band, so its strain is closely related, perhaps after a change in the number of repeats at one VNTR, and P5 may also be part of the outbreak.

Identical fingerprints show that patients have the same strain but not who infected whom; the strain might also be common in the city.

Explanation

Genetic fingerprinting compares the lengths of VNTR fragments: individuals (or strains) with identical patterns at several VNTRs are very likely to be the same or very closely related. Fragments separate by length because DNA is negatively charged and shorter fragments move through the gel faster. Primers that bind only to the pathogen's DNA make sure that the patient's own DNA is not amplified. Estimate a fragment's length from the ladder by comparing its position with the bands of known length. Remember that a shared pattern shows relatedness, not the direction of transmission.

Mark scheme
  1. 1 mark

    The sputum also contains the patient's (human) DNA, so only the bacterial VNTRs are amplified and the bands show the fingerprint of the bacterium, not of the patient

    Max 7. Accept 'otherwise human VNTRs would also be amplified and give extra bands'. Insufficient: 'so only the right DNA is amplified' with no idea of the patient's DNA.

  2. 1 mark

    DNA is negatively charged (phosphate groups) and moves towards the positive electrode, and shorter fragments move faster / further through the gel

    Both ideas are needed. Accept 'smaller' for shorter.

  3. 1 mark

    500 base pairs (accept 480 to 540)

    A correct answer with no working scores the mark.

  4. 1 mark

    P1, P2, P3 and P4 have identical (band) patterns, so they were infected with the same strain / were probably infected from the same source / from each other

    Points 4 to 6: max 3.

  5. 1 mark

    P6 has a completely different pattern, so it is a different strain / P6 was infected separately and is not part of the outbreak

  6. 1 mark

    P5 differs from P1 to P4 in only one band, so its strain is closely related (e.g. a change in the number of repeats at one VNTR), so P5 may be part of the outbreak

    Accept 'P5 is a different strain' only if the similarity in three of the four bands is also noted.

  7. 1 mark

    Identical fingerprints do not show the direction of infection / who was the source / the same strain may be common in the city, so patients may have been infected separately / only a few VNTRs were compared

    One correct limitation scores the mark. List rule: if more than one limitation is given, a wrong or contradictory extra answer cancels the mark.

Question 3

8 marks

Some plants flower only after a long period of cold, such as a winter. In one species, gene F codes for a protein that inhibits flowering.

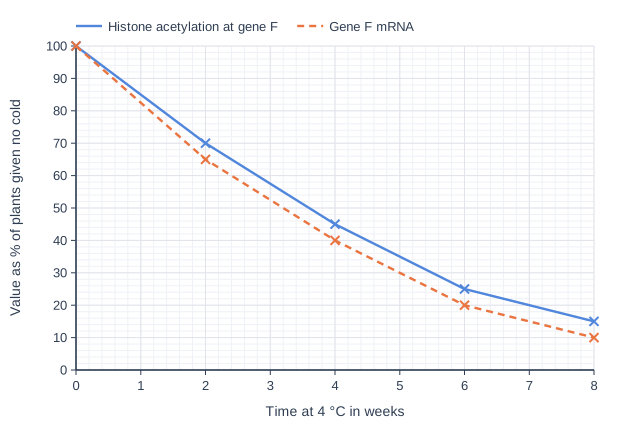
Scientists kept groups of genetically identical plants at 4 °C for 0, 2, 4, 6 or 8 weeks. Immediately after the cold treatment, they measured the acetylation of the histones associated with gene F and the amount of mRNA transcribed from gene F, each as a percentage of the value in plants given no cold. They then moved all the plants to 20 °C. The graph shows their results.

The plants given no cold did not flower within 90 days. Those given 2, 4, 6 and 8 weeks of cold flowered after 62, 41, 28 and 24 days. Leaves that grew from new cells after the plants were moved to 20 °C also had low acetylation of the histones associated with gene F.

Calculate the percentage decrease in the time taken to flower between plants given 2 weeks and plants given 8 weeks of cold. Give your answer to 3 significant figures.

Use all the information to explain how a long period of cold leads to earlier flowering.

The scientists concluded that the decrease in histone acetylation caused the decrease in transcription of gene F. Evaluate this conclusion.

Line graph of value as % of plants given no cold (y-axis, 0 to 100) against time at 4 °C in weeks (x-axis, 0 to 8). "Histone acetylation at gene F" joins the points (0, 100), (2, 70), (4, 45), (6, 25), (8, 15). "Gene F mRNA" (dashed) joins the points (0, 100), (2, 65), (4, 40), (6, 20), (8, 10).

Model answer

Percentage decrease = (62 - 24) ÷ 62 × 100 = 38 ÷ 62 × 100 = 61.3%

The longer the cold, the lower the acetylation of the histones associated with gene F (15% after 8 weeks). With fewer acetyl groups, the histones bind the DNA more tightly and the chromatin is more condensed, so transcription factors and RNA polymerase cannot bind to the promoter of gene F. Less gene F is transcribed (10% after 8 weeks), so less of the protein that inhibits flowering is made, and the plants flower sooner. This is an epigenetic change: the base sequence is unchanged, but the change in gene expression is passed on to new cells and lasts after the plants return to 20 °C.

The data support the conclusion, because acetylation and gene F mRNA fall together as the cold period increases. However, this is only a correlation: the cold could also cause other changes, such as methylation of the DNA, that reduce transcription, and less mRNA could result from faster breakdown of the mRNA rather than less transcription. The scientists did not reduce acetylation without cold to test the idea directly.

Explanation

Decreased acetylation of histones makes DNA wind more tightly, so transcription factors cannot reach the promoter and transcription is inhibited; this is one of the two epigenetic mechanisms in the specification (with increased DNA methylation). Here the environment (cold) silences a gene for a flowering inhibitor, and because the change is passed to new cells by mitosis the plant 'remembers' the winter. When evaluating a cause-and-effect conclusion, credit the correlation, then point out other possible causes and the lack of a direct test.

Mark scheme
  1. 1 mark

    Correct method: (62 - 24) ÷ 62 × 100; or a correct final answer of 61.3 with no working

    Max 8. A correct answer of 61.3% with no working scores 2 marks (points 1 and 2). Accept for 1 mark: 0.613 (not multiplied by 100) OR 158 (difference divided by 24) OR 61 or 61.29 (not given to 3 significant figures).

  2. 1 mark

    61.3 (%)

  3. 1 mark

    Cold decreases the acetylation of histones (associated with gene F), e.g. to 15% after 8 weeks

    Points 3 to 7: max 3.

  4. 1 mark

    Less acetylation makes the chromatin more condensed / DNA more tightly wound around the histones

    Accept 'histones bind DNA more tightly'.

  5. 1 mark

    So transcription factors / RNA polymerase cannot bind to (the promoter of) gene F, so less gene F is transcribed (mRNA falls to 10%)

    Reject translation for transcription.

  6. 1 mark

    So less of the protein that inhibits flowering is made (translated), so the plants flower sooner (the longer the cold, the sooner they flower)

    Accept 'less inhibitor' for this point.

  7. 1 mark

    This is an epigenetic change: gene expression changes without a change in the base sequence (the plants are genetically identical) AND it is passed to new cells (by mitosis) / lasts after the plants return to 20 °C

    Both parts needed.

  8. 1 mark

    (Supports) acetylation and gene F mRNA decrease together as the cold period increases / positive correlation between acetylation and mRNA

    Points 8 to 11: max 3, with at most 1 mark from point 8 (for the conclusion) and at most 2 marks from points 9 to 11 (against it). Accept correct values from the graph (within 5%).

  9. 1 mark

    Correlation does not show causation / a different change caused by the cold (e.g. DNA methylation or a change in transcription factors) could have reduced transcription

  10. 1 mark

    Less mRNA could be due to faster breakdown of mRNA (e.g. RNA interference) rather than less transcription

  11. 1 mark

    Acetylation was not changed directly / no experiment in which acetylation was reduced without cold (e.g. using an inhibitor or a mutant)

Question 4

8 marks

In a species of tropical butterfly, adults that develop in the wet season have large eyespots on their wings and adults that develop in the dry season have small eyespots.

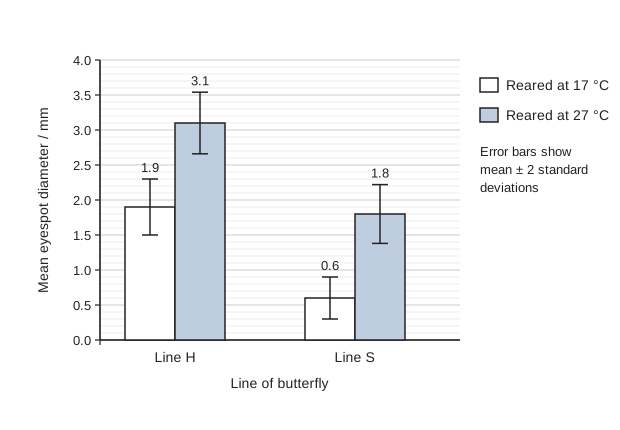
Scientists kept two lines of the butterfly that had been selected for many generations: line H was selected for large eyespots and line S for small eyespots. They reared caterpillars from each line at 17 °C or 27 °C, the typical temperatures of the dry and wet seasons, and measured the eyespot diameter of the adults. The figure shows their results.

Calculate the percentage increase in mean eyespot diameter for line S between 17 °C and 27 °C.

Suggest two variables, other than temperature, that the scientists should have kept the same when rearing the caterpillars.

What can you conclude about the relative influences of genetic and environmental factors on eyespot diameter? Use the data to support your answer.

Suggest how the temperature at which the caterpillars develop could affect the size of the eyespots.

A bar chart of mean eyespot diameter in mm (0 to 4.0) for line H and line S of a butterfly. For each line there are two bars: reared at 17 °C (white) and reared at 27 °C (shaded). Each bar has an error bar showing mean ± 2 standard deviations, and its mean printed above it. Line H: 17 °C 1.9 mm (error bar 1.5 to 2.3), 27 °C 3.1 mm (error bar about 2.66 to 3.54). Line S: 17 °C 0.6 mm (error bar 0.3 to 0.9), 27 °C 1.8 mm (error bar about 1.38 to 2.22).

Model answer

Percentage increase = (1.8 - 0.6) ÷ 0.6 × 100 = 1.2 ÷ 0.6 × 100 = 200%

The scientists should have kept the food plant and the day length the same for all the caterpillars.

Both genetic factors and the environment affect eyespot diameter. At each temperature line H has eyespots about 1.3 mm larger than line S (1.9 compared with 0.6 mm at 17 °C, and 3.1 compared with 1.8 mm at 27 °C), and in each line rearing at 27 °C increases the diameter by about 1.2 mm, so the two factors have similar influences. Line H reared at 17 °C and line S reared at 27 °C have almost the same eyespot size (1.9 and 1.8 mm, with overlapping error bars), so different combinations of genotype and environment can produce the same phenotype. The other error bars do not overlap, so those differences are unlikely to be due to chance.

Temperature could change the concentration of a hormone or transcription factor during development, which changes the transcription of genes that control the size of the eyespots.

Explanation

To compare the two lines fairly, every other condition during development that could affect eyespot size, such as food, day length and humidity, must be the same. To compare genetic and environmental influences, look at the effect of one factor while the other is fixed: here the difference between lines (genetic) and between temperatures (environment) are about the same size. Overlapping error bars (± 2 SD) mean a difference may be due to chance; non-overlapping bars suggest a real difference. The environment usually affects phenotype by changing gene expression, for example through hormones or transcription factors.

Mark scheme
  1. 1 mark

    Correct method: (1.8 - 0.6) ÷ 0.6 × 100; or a correct final answer of 200 with no working

    Max 8. A correct answer of 200% with no working scores 2 marks (points 1 and 2). Accept for 1 mark: 2 (not multiplied by 100) OR 66.7 (difference divided by 1.8) OR 300 (1.8 ÷ 0.6 × 100).

  2. 1 mark

    200 (%)

  3. 2 marks

    1 mark for each suitable variable, max 2: type / amount of food (the food plant); day length / light intensity; humidity; number of caterpillars per container (density); age of the caterpillars at the start

    Point 3 (2 marks): 1 mark for each suitable variable, max 2. List rule: if more than two variables are given, each wrong or contradictory extra answer cancels one correct answer. Ignore 'temperature' and 'line' (the variables being investigated).

  4. 1 mark

    Both genetic factors (the line) and the environment (temperature) affect eyespot diameter

    Points 4 to 8: max 3.

  5. 1 mark

    The effect of genotype is similar at both temperatures: line H is about 1.3 mm larger than line S at 17 °C (1.9 compared with 0.6) and at 27 °C (3.1 compared with 1.8)

    Accept 'the line makes a difference of 1.3 mm'.

  6. 1 mark

    The effect of temperature is similar in both lines: about 1.2 mm larger at 27 °C than at 17 °C, so genetic and environmental factors have similar influences

  7. 1 mark

    Line H at 17 °C and line S at 27 °C have similar eyespots (1.9 and 1.8 mm, error bars overlap), so different combinations of genotype and environment can give the same phenotype

    Accept 'the difference between them may be due to chance'.

  8. 1 mark

    The other error bars (within each line and within each temperature) do not overlap, so these differences are (probably) not due to chance / are significant

    Reject 'the results are not due to chance' and 'the results are significant'.

  9. 1 mark

    Temperature affects the concentration of a hormone / transcription factor (or the activity of an enzyme), which changes the transcription / expression of genes for eyespot size or pigment

    Accept epigenetic change (methylation / acetylation) caused by temperature that affects transcription of eyespot genes.

Ready to try the rest? Every answer you write is marked against the mark scheme, so you can see exactly where the marks are.

Study Helper Hints first, answers after you try

Stuck on this one? Ask for a hint and I’ll point you in the right direction, without giving the answer away. Once you’ve checked your answer, I’ll show you how the marks are awarded.