
Level:
Correct: 0
Incorrect: 0
Marks: 0/0
Exam Practice
Course:
Topics:
AQA A-Level Biology (Paper 3) Smart practice A mixed round aimed at your weak spots
Unit 1
Required practical activities
Unit 2
Practical and mathematical skills
Unit 3
Critical analysis of experimental data
Unit 4
The essay
Avg
score:
–
Topics
done:
0/26

Required practical 12: distribution of a species

Practise 16 exam-style questions on Required practical 12: distribution of a species for AQA A-Level Biology (Paper 3). Write your answer as you would in the exam and get it marked in seconds against the mark scheme, point by point, with the Study Helper on hand if you get stuck.

  • 16 questions
  • 1–8 marks each
  • Instant marking
  • No sign-up needed
16 questions, marked as you go

Sample questions with model answers

Here are 4 of the questions in this topic, each with a model answer, an explanation of why it earns the marks and the mark scheme an examiner would use.

Question 1

2 marks

A student investigated whether the distribution of a moss on a hillside is related to temperature. She placed a temperature probe connected to a data logger at a site where the moss grew and another at a nearby site where it did not. Each data logger recorded the temperature every 10 minutes for 7 days.

Explain why this gives more useful data than taking a single reading with a thermometer at each site.

Model answer

Temperature changes between day and night and with the weather, so a single reading at each site might not represent the conditions the moss usually experiences. The data loggers record many readings at both sites at the same times over 7 days, so the student can calculate and compare the mean, maximum and minimum temperatures at the two sites.

Explanation

Abiotic factors such as temperature and light vary over time, so a single reading is a poor measure of the conditions a plant experiences. Data loggers take readings at regular intervals over a long period, at several sites at once and without an observer, so the sites can be compared fairly using means and ranges.

Mark scheme
  1. 1 mark

    Temperature varies with the time of day / between day and night / with the weather, so a single reading may not be representative

    Max 2.

  2. 1 mark

    The loggers record many readings at both sites at the same times, so the sites can be compared fairly / a mean, maximum and minimum temperature can be calculated for each site

    Accept 'shows the range of temperatures the moss experiences'.

  3. 1 mark

    Readings are taken continuously, including at night, without anyone being present / with no reading errors by the student
Question 2

3 marks

Students used a belt transect to investigate the distribution of plant species across a sand dune system, from the strandline at the top of the beach to the older dunes inland.

Give two things the students should do to reduce their effect on the dune plants and the habitat. Give one safety precaution they should take.

Model answer

They should keep to existing paths where possible and step carefully between plants, because trampling damages the dune plants that hold the sand together and can start erosion. They should identify plants where they grow instead of picking them.

Safety: they should wear sun protection and carry water, because the open dunes can be hot and exposed.

Explanation

Ethical fieldwork keeps damage to organisms and habitats to a minimum. Sand dunes are fragile: plants such as marram grass bind the sand, so trampling or uprooting them can start erosion, and some birds nest on the ground. The main hazards on dunes are sun and heat, loose steep slopes and, near the beach, the tide. Each answer should be a specific action, not just 'be careful'.

Mark scheme
  1. 1 mark

    Keep to existing paths / walk carefully between plants, to avoid trampling the dune plants (which hold the sand together and prevent erosion)

    Max 3: max 2 from points 1 to 6 and point 7. List rule: if more than two answers are given for the habitat, or more than one for safety, each wrong or contradictory extra answer cancels one correct answer.

  2. 1 mark

    Do not pick / uproot / remove plants (identify them where they grow, or photograph them)

  3. 1 mark

    Use only as many quadrats / visits as needed / keep the group small / spend as little time as possible on the dunes

  4. 1 mark

    Avoid disturbing animals, e.g. ground-nesting birds (or work outside the breeding season)

  5. 1 mark

    Do not dig into the dunes / fill in any holes that are dug

  6. 1 mark

    Take all equipment and litter away

  7. 1 mark

    Safety: wear sun protection and carry water (exposed, hot dunes) OR check tide times when working near the strandline OR work in groups and tell someone where they are OR take care on steep or loose sand slopes OR wash hands after handling plants or sand

    Any one safety precaution. Ignore 'be careful' unqualified.

Question 3

4 marks

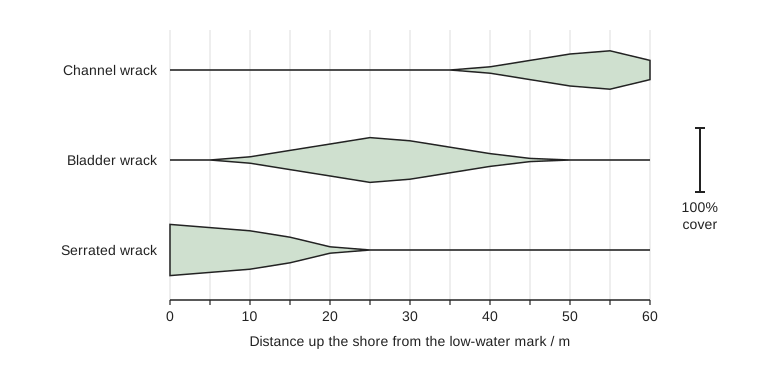
Students investigated the distribution of three species of seaweed on a rocky shore. They laid a tape from the low-water mark straight up the shore and estimated the percentage cover of each species in a quadrat every 5 m. The kite diagram shows their results. The width of each kite shows the percentage cover; the scale bar shows the width for 100% cover.

Give the distance up the shore at which bladder wrack had its greatest percentage cover.

The upper shore is covered by the sea for a much shorter time than the lower shore. Channel wrack grows only on the upper shore. Suggest one abiotic factor that could explain why channel wrack can grow on the upper shore when other seaweeds cannot, and explain your answer.

Suggest one reason why channel wrack does not grow on the lower shore.

Kite diagram with three kites, one for each species, against distance up the shore from the low-water mark, from 0 to 60 m with grid lines every 5 m. Serrated wrack is drawn at the bottom, bladder wrack in the middle and channel wrack at the top. Serrated wrack occupies the low-water end of the transect, bladder wrack the middle and channel wrack the upper end. A scale bar beside the diagram shows the kite width for 100% cover.

Model answer

Bladder wrack had its greatest percentage cover at 25 m.

The upper shore is exposed to the air for long periods between tides, so seaweeds there lose water (desiccation) and get hot. Channel wrack can tolerate long periods of drying out, which kill the other seaweeds, so only channel wrack survives on the upper shore.

On the lower shore, channel wrack is probably outcompeted for space and light by bladder wrack and serrated wrack, which grow faster where they are covered by the sea for longer.

Explanation

A kite diagram shows abundance along a transect: the wider the kite, the greater the percentage cover. Zonation on a rocky shore is explained by abiotic factors, especially time exposed to the air (desiccation and temperature), which set the upper limit of each species, and by biotic factors such as competition, which often set the lower limit. Each answer should link the factor to how it affects the seaweeds.

Mark scheme
  1. 1 mark

    25 m

    Accept 25 m with any unit omitted. Do not accept a range.

  2. 1 mark

    Abiotic factor: time exposed to the air (between tides) / desiccation / drying out OR temperature (higher when exposed) OR salinity changes (e.g. rain or evaporation in exposed pools)

    Accept 'water loss' for desiccation. Ignore 'light' unless explained (e.g. light in air).

  3. 1 mark

    Explanation: channel wrack can tolerate / survive long periods of exposure / water loss / high temperatures, which kill the other seaweeds

    The explanation must match the factor given in point 2.

  4. 1 mark

    It is outcompeted (e.g. for space or light) by other seaweeds (bladder wrack / serrated wrack) that grow faster where they are covered by the sea for longer

    Accept interspecific competition described. Accept 'grazed by animals that live lower on the shore'. Ignore 'it cannot survive under water' unqualified.

Question 4

6 marks

Mayfly nymphs (larvae) live among the stones on the beds of shallow streams. A student wants to investigate whether the distribution of one species of mayfly nymph along a stream is related to the speed of water flow.

She has a kick net, white trays, an identification key, a stopwatch, a tape measure and an orange to use as a float.

Describe a method she could use. Your answer should include how she would make her results valid and how she would treat the animals ethically.

Do not include details of safety in your answer.

Model answer

1. Choose at least five sites along the stream with different flow speeds, from fast riffles to slow pools.
2. At each site, measure 5 m along the bank with the tape, time how long the orange takes to float this distance, and calculate speed = 5 ÷ time. Repeat three times and calculate the mean.
3. Hold the kick net on the stream bed and disturb the stones just upstream for exactly 30 s, over the same area each time.
4. Empty the net into a white tray of stream water, identify the nymphs with the key and count those of this species.
5. Take three kick samples at each site and calculate the mean number of nymphs.
6. Sample every site on the same day so that the flow is not changed by rain.
7. Return all the animals to the stream at the place where they were caught.
8. Use Spearman's rank correlation coefficient to test for a significant correlation between flow speed and the number of nymphs.

Explanation

A distribution study needs both the abundance of the species and the environmental factor measured at the same sites, with the sampling effort standardised so that sites can be compared. Repeats and means improve the reliability of both measurements. Because both variables are measured, a correlation coefficient (Spearman's rank) is the right test. Ethical fieldwork returns animals to their habitat with as little disturbance as possible.

Mark scheme
  1. 1 mark

    Choose several (at least 5) sampling sites along the stream with different flow speeds (e.g. fast riffles and slow pools), or at regular intervals

    Max 6.

  2. 1 mark

    Flow speed: time how long the orange takes to float a measured distance (e.g. 5 m) and calculate speed = distance ÷ time

    Accept the use of a flow meter.

  3. 1 mark

    Repeat the flow measurement (e.g. three times) at each site and calculate a mean

  4. 1 mark

    Kick sampling: hold the net on the stream bed and disturb the stones upstream of it for a set time (e.g. 30 s)

  5. 1 mark

    Keep the sampling the same at each site: same time, same area of stream bed, same depth / same person kicking

    Ignore 'keep everything the same' unqualified.

  6. 1 mark

    Empty the net into a white tray of stream water and count the nymphs of this species, using the key to identify them

  7. 1 mark

    Take several kick samples at each site and calculate the mean number of nymphs

  8. 1 mark

    Sample all the sites on the same day / in the same weather (because flow changes after rain)

  9. 1 mark

    Return the animals to the stream where they were caught / keep them in stream water in the shade and count them quickly

  10. 1 mark

    Use Spearman's rank correlation coefficient to test whether there is a significant correlation between flow speed and the number of nymphs

    Accept 'correlation coefficient'. Do not accept chi-squared or t-test.

Ready to try the rest? Every answer you write is marked against the mark scheme, so you can see exactly where the marks are.

Study Helper Hints first, answers after you try

Stuck on this one? Ask for a hint and I’ll point you in the right direction, without giving the answer away. Once you’ve checked your answer, I’ll show you how the marks are awarded.